Inflation
Subject: Economics
Age range: 16+
Resource type: Lesson (complete)
Included in this PowerPoint:
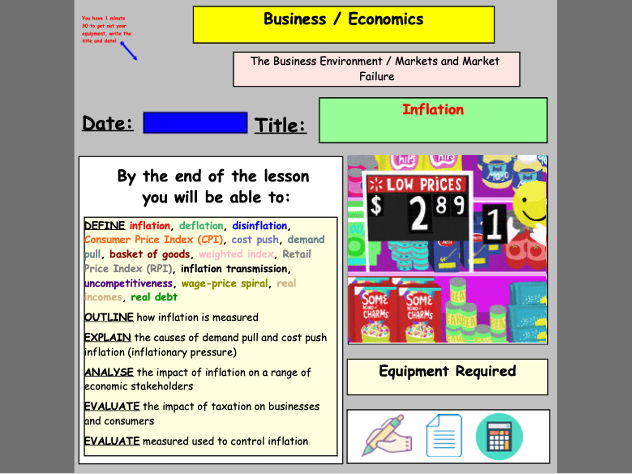
A detailed and colourful title slide that outlines the key learning outcomes and equipment required for the lesson
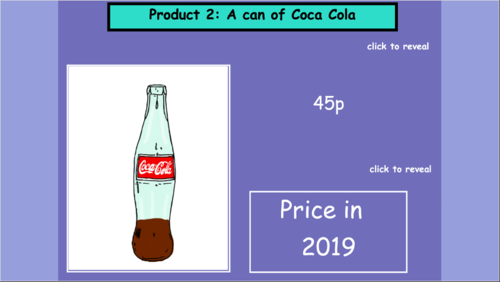
A starter activity where students are required to guess how the price of 5 goods and services has changed over time (closest for each round wins). Students really enjoy this activity
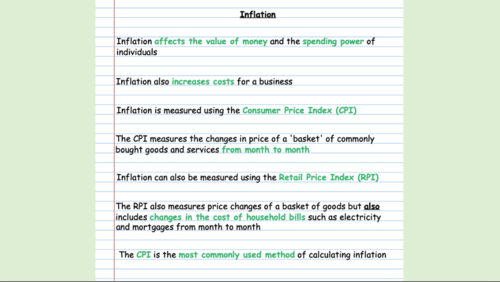
Explanation of why / when inflation becomes a problem, how it affects incomes and sectors where incomes have risen lower and higher than inflation
Explanation in basket of goods / weighted index
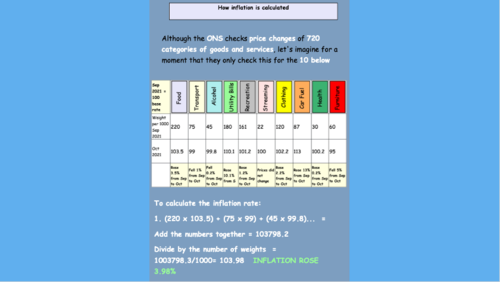
Step by step explanation of how inflation is calculated using weighted index
Activity (with answers) where students are required to calculate inflation changes using a weighted index
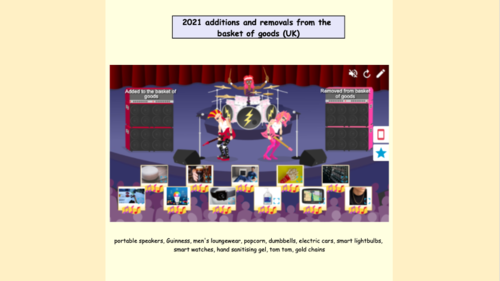
Activity (with answers) - identify which goods and services have been recently added and removed from the basket of goods
Explanation of difference between demand-pull and cost-push inflation with examples
Diagrams for both types of inflation
Presentation is detailed and colourful throughout
There are 52 slides in total and this presentation took me an hour and a half to go through.
Something went wrong, please try again later.
This resource hasn't been reviewed yet
To ensure quality for our reviews, only customers who have purchased this resource can review it
Report this resourceto let us know if it violates our terms and conditions.
Our customer service team will review your report and will be in touch.