


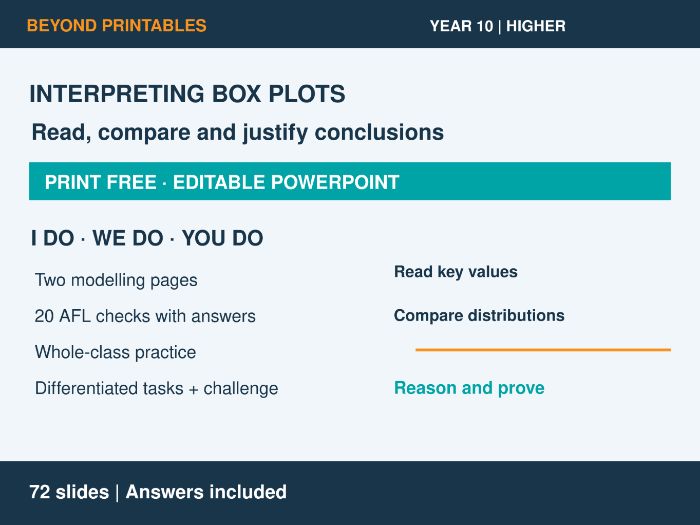
Build confident interpretation of box plots with this print-free Year 10 Higher maths lesson. Pupils progress from reading medians and quartiles to comparing distributions, estimating numbers of observations and explaining what a box plot can and cannot tell them. The editable PowerPoint keeps diagrams and questions together so pupils can work directly from the classroom screen.
WHAT IS INCLUDED?
A 72-slide PowerPoint with retrieval practice, prerequisite checks, an annotated vocabulary diagram, teaching guidance, paired I Do / We Do modelling, 20 AFL checks with answers, whole-class practice, differentiated tasks, a Super Challenge, misconceptions, an exam-style question and exit checks. Answers and worked explanations are included throughout.
MODEL THE THINKING
Begin with the five-number summary, range and interquartile range. Model how to read a box plot accurately before moving into paired comparison examples. Pupils use medians to compare typical values and IQRs to compare the spread of the middle 50%. Worked responses demonstrate how to support a comparison with figures and explain it in the context of journey times.
WHOLE-CLASS PRACTICE
One screen contains three box plots and 30 questions. Pupils read minimums, medians and quartiles, calculate ranges and IQRs, find whisker lengths and estimate counts using the stated sample sizes. All 30 answers appear together on one page for efficient checking.
DIFFERENTIATION ON ONE SCREEN
Developing, Secure, Greater Depth and the Super Challenge share one activity slide, with the relevant plots visible above the questions. Eight Developing questions secure reading and calculations. Four Secure questions introduce estimated counts and written comparisons. Three Greater Depth questions ask pupils to test claims, recognise limits on exact counts and explain why a larger median does not force a larger range.
A CHALLENGE THAT REQUIRES REASONING
The Super Challenge explores whether a fixed five-number summary determines the mean. Pupils first prove a result for eight ordered scores, then construct two twelve-score data sets with the same summary but different means. Worked solutions show the reasoning and provide valid examples, focusing on mathematical structure.
CHECK UNDERSTANDING
Misconception questions address median versus mean, box width versus frequency, comparisons of individual values and the effect of ties. A six-mark exam-style task combines calculation, contextual comparison, an estimated count and a limitation of box plots. Three exit checks help identify what pupils can apply independently.
Designed for projection: no printed worksheets are required. Pupils can record calculations and explanations in exercise books or on mini whiteboards. The editable PPTX lets you adjust pacing, select questions and revisit explanations to suit your class. Suitable for Year 10 Higher teaching, consolidation and GCSE revision. Exam-style questions are original, with suggested teaching marks.
Something went wrong, please try again later.
This resource hasn't been reviewed yet
To ensure quality for our reviews, only customers who have purchased this resource can review it
Report this resourceto let us know if it violates our terms and conditions.
Our customer service team will review your report and will be in touch.
£3.00