


Teach pupils to interpret cumulative frequency graphs with this print-free Year 10 Higher maths lesson. Pupils work with counts, quartiles, interquartile ranges, percentages and cutoffs, then explore what grouped data can and cannot reveal about individual values.
WHAT IS INCLUDED?
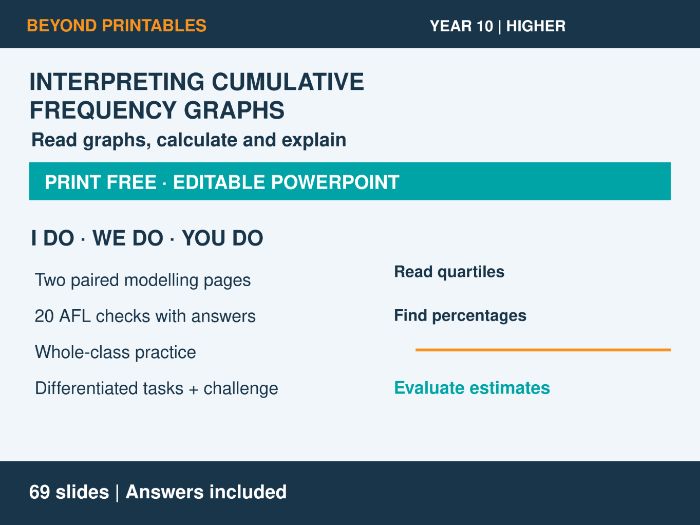
A 69-slide PowerPoint with six retrieval questions and answers, prerequisite checks, teaching guidance, two I Do / We Do modelling pages, 20 AFL checks with answers, whole-class practice, differentiated tasks, a Super Challenge, misconceptions, an exam-style task and three exit checks. Worked answers are included throughout.
MODEL THE INTERPRETATION
The first modelling page pairs examples on reading cumulative counts, finding how many journeys exceed a time and estimating the median, quartiles and interquartile range. The second models counts within an interval, percentages and time cutoffs. Each page has three matched I Do / We Do pairs using different graphs. Worked solutions explain the calculations, with guide lines showing relevant graph readings.
SUBSTANTIAL PRACTICE ON ONE SCREEN
Three cumulative frequency graphs share one practice page. Pupils answer ten prompts for each figure, giving 30 short tasks without copying graphs. They identify totals, read counts, subtract to find numbers above a value or within an interval, estimate quartiles and calculate percentages. Answers for all three figures appear together on one page.
DIFFERENTIATION ON ONE PAGE
The three reference graphs sit above Developing, Secure and Greater Depth questions, with a clearly separated Super Challenge below. Seven Developing questions consolidate reading one graph. Four Secure questions cover interval counts, percentages, a cutoff and quartiles on other graphs. Three Greater Depth questions ask pupils to interpret a horizontal section, explain why an interior reading is an estimate and compare identical cumulative counts from samples of different sizes.
A CHALLENGE ABOUT WHAT IS POSSIBLE
The Super Challenge starts with an estimated count, then asks for the minimum and maximum possible actual counts consistent with the class-boundary totals. Pupils also decide whether a stated actual median is possible and justify their reasoning using positions in the ordered data. The worked solution distinguishes an interpolated estimate from the underlying observations.
CHECK UNDERSTANDING
Twenty AFL question-and-answer pairs suit mini whiteboards. Misconception checks address median positions, counts above and below a value, sample totals and interpolation. A six-mark exam-style task and three exit checks provide further assessment. Graph readings allow sensible variation; practice count estimates are rounded to whole journeys.
No printed worksheets are required: pupils read the projected graphs and write answers in books or on mini whiteboards. Suitable for Year 10 Higher teaching, consolidation and GCSE revision. Exam-style questions are original, with suggested teaching marks.
Something went wrong, please try again later.
This resource hasn't been reviewed yet
To ensure quality for our reviews, only customers who have purchased this resource can review it
Report this resourceto let us know if it violates our terms and conditions.
Our customer service team will review your report and will be in touch.
£3.00