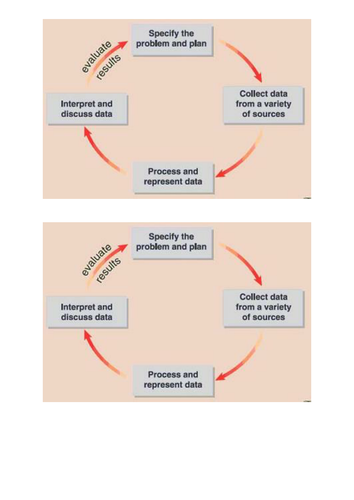

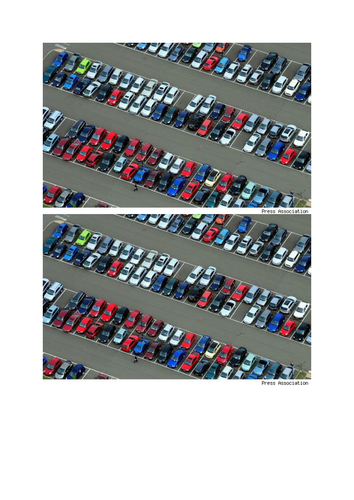
This lesson gives an intro to primary and secondary data collection. I use this with my Y7 low ability students. It involves taking them to collect car colour data from the staff car park!! We then use a secondary sources to collect car colour data and compare the two. This can also lead on to the analysis and presentation of the data. I have sued it as a data source for bar charts, dual bar charts and also pictograms. It is also an opportunity for the students to discuss and make their own hypotheses.
Something went wrong, please try again later.
The powerpoint is clear, but I would have hoped for a template for students to complete their research. It's a good start, but for the amount paid I would have expected more supplementary resources to go along with it as it required me preparing things myself.
Report this resourceto let us know if it violates our terms and conditions.
Our customer service team will review your report and will be in touch.
£1.00