

The presentation introduces the idea of drawing a graph to represent how quickly a container fills with liquid over time. The print-version can be given to pupils to make notes on and complete as the presentation is shown.
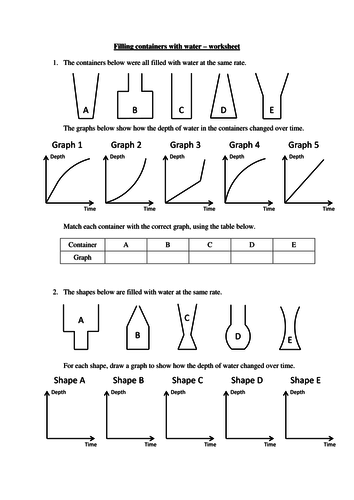
The worksheet is designed to test their understanding after completing the presentation (answers are included).
The worksheet is designed to test their understanding after completing the presentation (answers are included).
Something went wrong, please try again later.
This resource hasn't been reviewed yet
To ensure quality for our reviews, only customers who have purchased this resource can review it
Report this resourceto let us know if it violates our terms and conditions.
Our customer service team will review your report and will be in touch.
£2.00