


This resource is suitable for Key Stage 3 Year 7 as part of the Computing curriculum (using software to analyse and solve problems etc) and the Functional Skills L1/L2 ICT specifications for processing numerical data and creating charts and graphs. The resources contain the following:
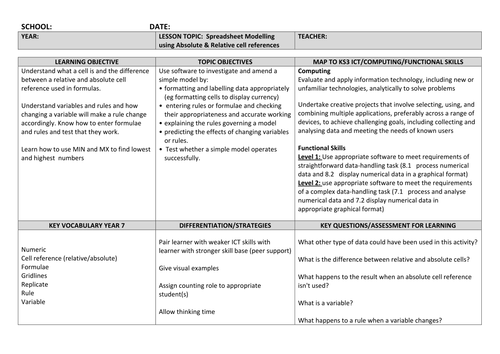
1. Lesson plan
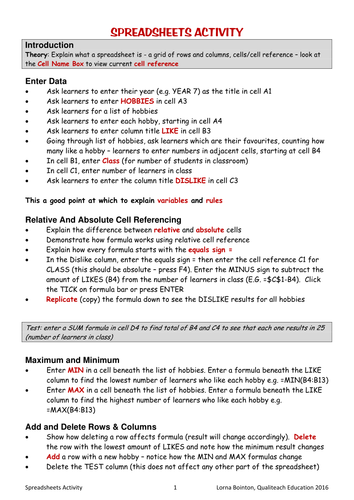
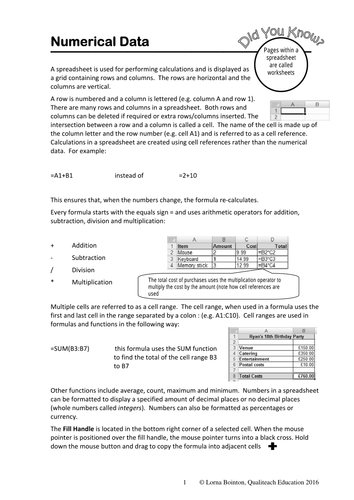
2. Starter activities/lessons/worksheets - 11 pages containing explanations, practical 'how to do it' help sheets (in Excel 2010), questions (with answers) and practical exercises covering data entry, formatting, using formulas and functions, create a pie chart, create a column chart
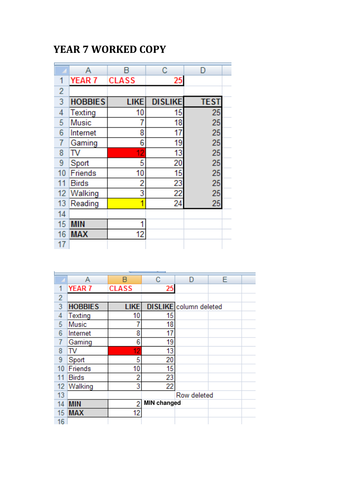
3. Build-up exercise for the teacher to work through with the learners. The data for this exercise is generated by the learners (their hobbies) which enables each learner to be involved in the data and provides a sense of 'ownership'. This covers data entry, variables and rules, relative and absolute cell referencing, using SUM, MIN, MAX functions and arithmetical formulas, adding and deleting rows/columns and noting changes in formula cells, formatting cells and creating charts/graphs. There is a worked copy included.
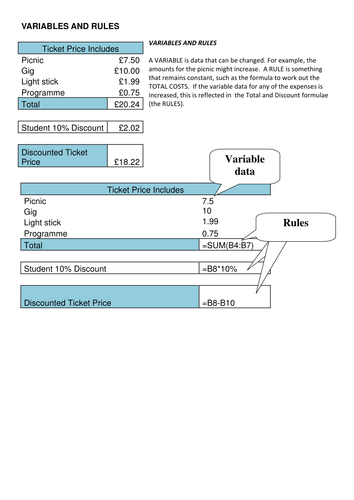
There is a worksheet included for Variables and Rules
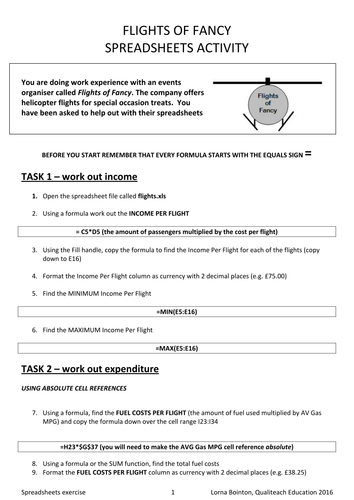
4. An extension activity with a data file and worked copy based on a helicopter tour business which covers using arithmetical formulas and functions to calculate revenue, discounts and expenditure , editing and formatting and creating graphs
1. Lesson plan
2. Starter activities/lessons/worksheets - 11 pages containing explanations, practical 'how to do it' help sheets (in Excel 2010), questions (with answers) and practical exercises covering data entry, formatting, using formulas and functions, create a pie chart, create a column chart
3. Build-up exercise for the teacher to work through with the learners. The data for this exercise is generated by the learners (their hobbies) which enables each learner to be involved in the data and provides a sense of 'ownership'. This covers data entry, variables and rules, relative and absolute cell referencing, using SUM, MIN, MAX functions and arithmetical formulas, adding and deleting rows/columns and noting changes in formula cells, formatting cells and creating charts/graphs. There is a worked copy included.
There is a worksheet included for Variables and Rules
4. An extension activity with a data file and worked copy based on a helicopter tour business which covers using arithmetical formulas and functions to calculate revenue, discounts and expenditure , editing and formatting and creating graphs
Something went wrong, please try again later.
This resource hasn't been reviewed yet
To ensure quality for our reviews, only customers who have purchased this resource can review it
Report this resourceto let us know if it violates our terms and conditions.
Our customer service team will review your report and will be in touch.
£6.00