


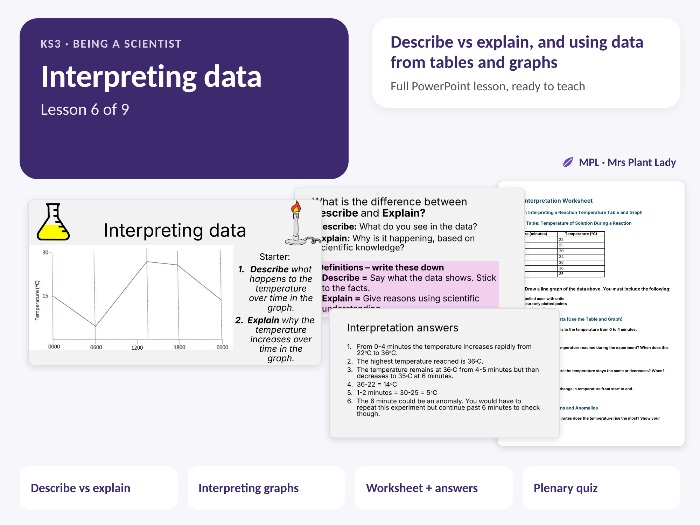
A ready-to-teach KS3 lesson from the Being a Scientist topic. In this lesson, students learn the difference between describe and explain, and use data from tables and graphs to support their answers.
What’s included
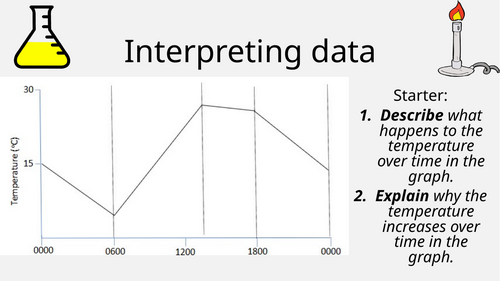
• Full PowerPoint lesson with starter and answers, lesson objectives, tasks and plenary
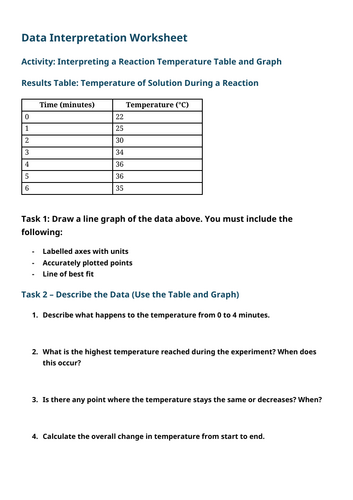
• Data interpretation worksheet with answers, plenary quiz
This lesson is part of the complete Being a Scientist topic, which includes all 8 lessons and an end-of-topic assessment.
Safety
If this lesson includes practical work, please follow your school’s own risk assessment and up-to-date CLEAPSS guidance, and adapt the practical to suit your students and lab.
Please check before teaching
Please read through the lesson and try any practical yourself before teaching it. You may need to adjust it for your school.
Terms of use
For use by the purchasing teacher in their own classroom. Please don’t share, resell or upload this resource elsewhere.
Something went wrong, please try again later.
This resource hasn't been reviewed yet
To ensure quality for our reviews, only customers who have purchased this resource can review it
Report this resourceto let us know if it violates our terms and conditions.
Our customer service team will review your report and will be in touch.
£1.50