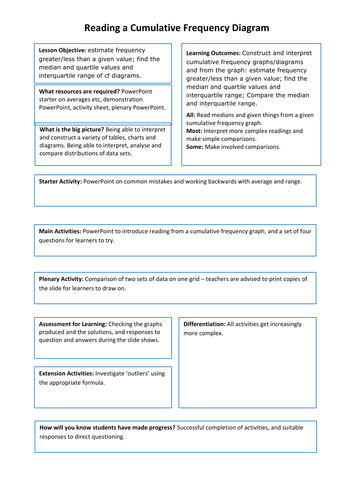

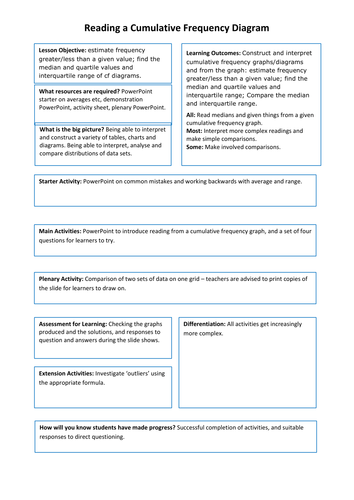
Everything you need for a lesson (or two) on reading and interpreting a cumulative frequency graph. Starter activity on PowerPoint to review average and range, with common mistakes and a more challenging question; a presentation in PowerPoint on reading and interpreting a cumulative frequency graph with two examples; learner activities, four questions in Word or PDF; a plenary presentation in PowerPoint to check learning; and a lesson plan to make the whole thing complete.
Suitable for high achievers at KS3, or Higher Tier on GCSE now and for the 2015 specs.
Can be uploaded to a VLE for the learners to follow themselves.
Suitable for high achievers at KS3, or Higher Tier on GCSE now and for the 2015 specs.
Can be uploaded to a VLE for the learners to follow themselves.
Get this resource as part of a bundle and save up to 50%
A bundle is a package of resources grouped together to teach a particular topic, or a series of lessons, in one place.
Something went wrong, please try again later.
This resource hasn't been reviewed yet
To ensure quality for our reviews, only customers who have purchased this resource can review it
Report this resourceto let us know if it violates our terms and conditions.
Our customer service team will review your report and will be in touch.
£1.00