
These resources are designed to aid the teaching and learning of using a graphical method to solve linear programming problems.
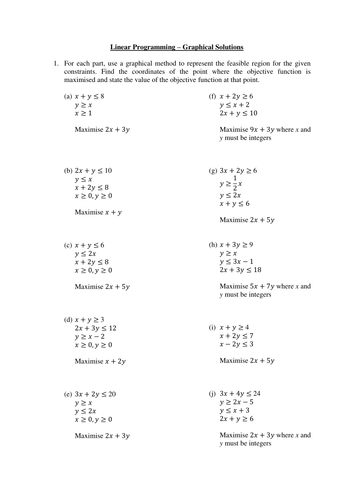
The first resource introduces the idea of representing inequalities on graphs and finding the point(s) that maximise a given objective function. There are also some examples that require integer solutions so the optimal point is not at a vertex of the feasible region.
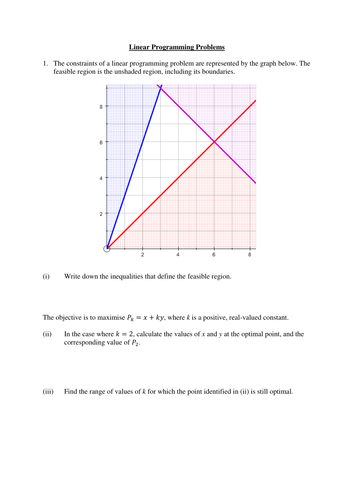
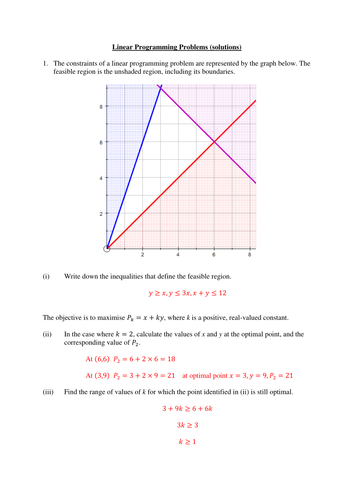
The second resource provides practice of solving problems with a provided graph - these are examination style questions and involve considering how changes to the objective function may change the optimal point(s).
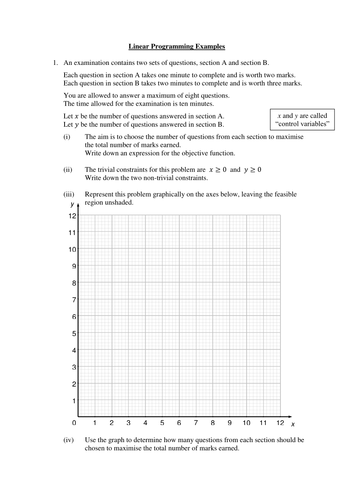
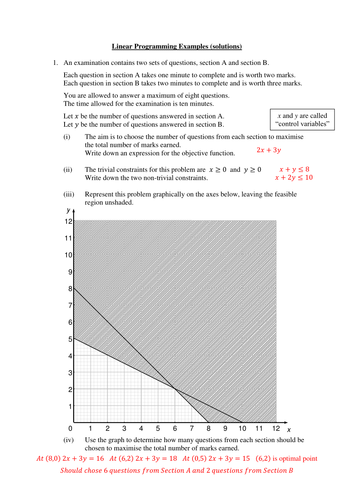
The third resource has 2 example questions in context where the students must use a description of a problem to formulate the objective function and the non-trivial constraints, and then go on to solve the problem graphically.
Grids are provided for all graphs and solutions are included for all questions.
The first resource introduces the idea of representing inequalities on graphs and finding the point(s) that maximise a given objective function. There are also some examples that require integer solutions so the optimal point is not at a vertex of the feasible region.
The second resource provides practice of solving problems with a provided graph - these are examination style questions and involve considering how changes to the objective function may change the optimal point(s).
The third resource has 2 example questions in context where the students must use a description of a problem to formulate the objective function and the non-trivial constraints, and then go on to solve the problem graphically.
Grids are provided for all graphs and solutions are included for all questions.
Something went wrong, please try again later.
This resource hasn't been reviewed yet
To ensure quality for our reviews, only customers who have purchased this resource can review it
Report this resourceto let us know if it violates our terms and conditions.
Our customer service team will review your report and will be in touch.
£3.00