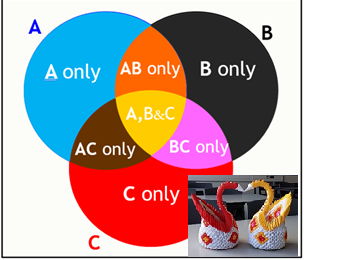

3-circle Venn diagrams are inherently more complex and difficult to visualize.
However, this presentation provides the critical solution to this complexity.
This carefully animated resource, visually isolates each specific region, making abstract concepts concrete.
Be assured that all the possible 8 regions on 3 circle Venn Diagram is defined and visualized.
It as a “ready-to-teach, zero-prep resource” that saves valuable time.
Get this resource as part of a bundle and save up to 42%
A bundle is a package of resources grouped together to teach a particular topic, or a series of lessons, in one place.
Something went wrong, please try again later.
This resource hasn't been reviewed yet
To ensure quality for our reviews, only customers who have purchased this resource can review it
Report this resourceto let us know if it violates our terms and conditions.
Our customer service team will review your report and will be in touch.
£5.00