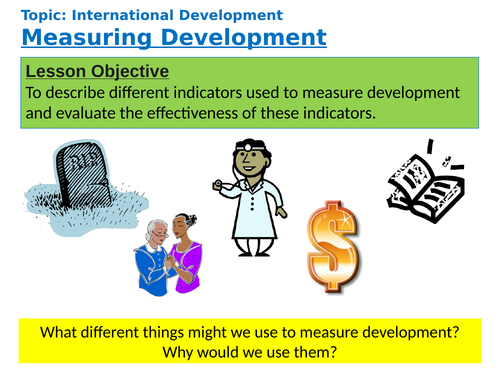

This lesson is designed to last for 50-60 minutes and is resourced with videos, extension questioning, deep thinking and uses graphs/images to aid learning.
This lesson follows the Oxford KS3 curriculum and looks at different developmental indicators such as mortality rate, birth rate, people per doctor and more. Students will also either create development top trump cards if not done from a previous lesson or create their own. Discussions regarding the cards are also provided.
This lesson includes a starter, lesson objective, plenary and various student led activities.
If you liked this resource please check out my other resources at https://www.tes.com/teaching-resources/shop/SimpleGeography
Get this resource as part of a bundle and save up to 17%
A bundle is a package of resources grouped together to teach a particular topic, or a series of lessons, in one place.
Something went wrong, please try again later.
This resource hasn't been reviewed yet
To ensure quality for our reviews, only customers who have purchased this resource can review it
Report this resourceto let us know if it violates our terms and conditions.
Our customer service team will review your report and will be in touch.