


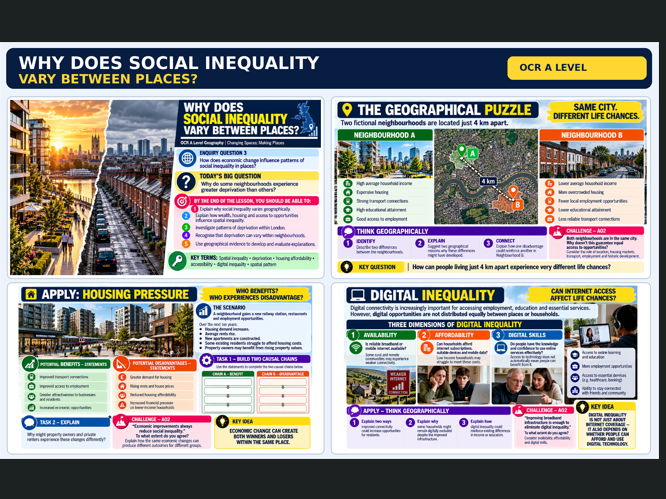
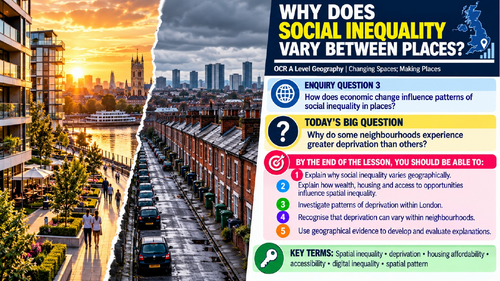
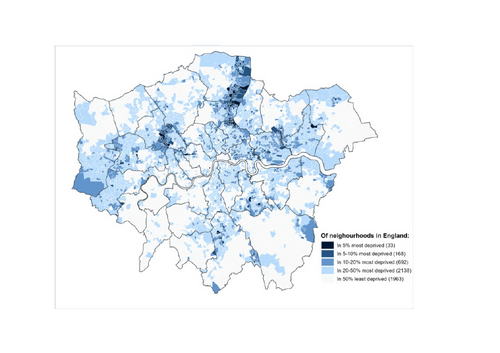
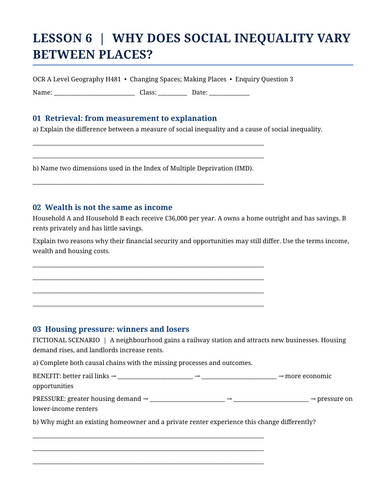
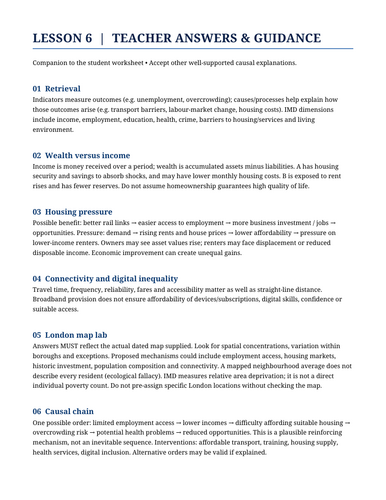
A fully resourced, engaging lesson exploring why social inequality varies between neighbourhoods and how wealth, housing affordability, transport accessibility and digital exclusion contribute to patterns of deprivation. Students develop geographical explanations through real-world London deprivation mapping, fictional place comparisons, data interpretation and causal-chain activities. The lesson includes retrieval practice, AO2 application, a structured OCR-style 6-mark exam question, model answer, editable student worksheet and teacher answers. Ideal for building confident geographical reasoning and exam skills.
Something went wrong, please try again later.
This resource hasn't been reviewed yet
To ensure quality for our reviews, only customers who have purchased this resource can review it
Report this resourceto let us know if it violates our terms and conditions.
Our customer service team will review your report and will be in touch.
£1.75