
These resources were used to guide year 9 pupils through this Key Stage 4 Required Practical.
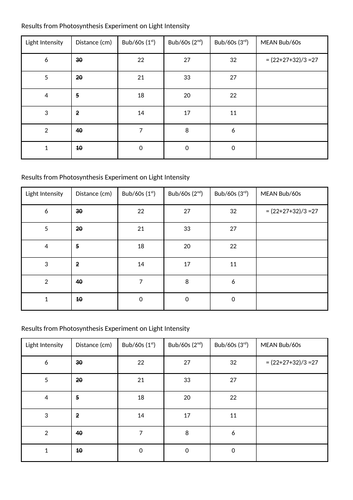
The experiment does not always work properly (in regards to approximating the intensity of the bubbles produced). Therefore, a sensible results table has been prepared, to share with the students.
Activities for the students were;
-design sensible experiment method
-revise different types of variables
- identify the inverse relationship between Light intensity and distance of lamp from the plant.
- correct the crossed-out data in table
- calculate averages of number of bubbles, use correct units.
- Make graph with correct X axis (light intensity or distance) and Y Axis (dependent, bubbles)
- analyse graph, is there correlation?
- explain graph, what is happening to cause bubbles?
Something went wrong, please try again later.
This resource hasn't been reviewed yet
To ensure quality for our reviews, only customers who have purchased this resource can review it
Report this resourceto let us know if it violates our terms and conditions.
Our customer service team will review your report and will be in touch.
£4.00