


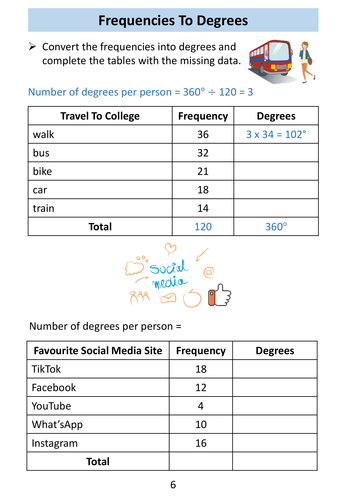
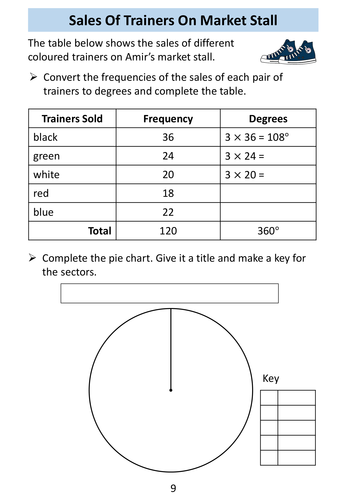
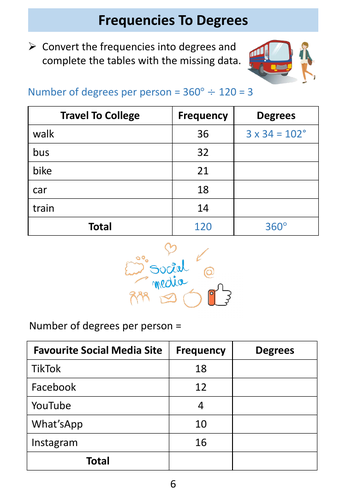
This resource contains two worksheets on pie charts where pupils are required to convert frequencies into degrees and organise and represent a data table in a pie chart.
You may also be interested in:
Functional Skills Maths Level 1 - Pie Charts - 40 Page Workbook
This resource has been designed for Entry Level 3 students working towards Functional Skills Maths qualifications at Level 1 (Edexcel-Pearson, NCFE, City and Guilds, AQA, Highfield Qualifications, NOCN, Open Awards). It contains a 50-page workbook on the statistics component - pie charts.
The workbook will help pupils to achieve these outcomes:
interpret information from pie charts
calculate the frequency of a sector of a pie chart
organise and represent data tables in pie charts.
The workbook includes 14 explanation pages, 23 worksheets, 2 progress checks and a certificate of achievement. It is provided in PDF and an editable PowerPoint version. It can be used for classwork, homework, revision or as an independent learning pack.
Level 1 - Mean and Range - 32 Page Workbook
Level 1 - Probability - 30 Page Workbook
Level 1 - Mean and Range - 75 Slide PowerPoint Lesson
Level 1 - Probability - 80 Slide PowerPoint Lesson
The bundles below contain workbooks and PowerPoints that cover all outcomes at each level.
Level 1 - Numbers and The Number System 10 Workbooks - 10 PowerPoints
Level 1 - Measures, Shape, Space Bundle
Entry 3 - 16 Workbooks - 16 PowerPoints
Entry 2 - 13 Workbooks - 13 PowerPoints
Something went wrong, please try again later.
Thank you.
Report this resourceto let us know if it violates our terms and conditions.
Our customer service team will review your report and will be in touch.
£0.00