
READY TO TEACH (LESSON 2/11 - URBANISATION: POPULATION PYRAMIDS).
Introduce the concept of population pyramids with the class, with reference to a definition (slide 2). Explain why population pyramids are so useful in Geography (discuss with pupils how we can find out about birth rates, death rates and life expectancy of a population within a country which can indicate a country’s level of development).
Pupils makes a note of key terms (slide 4). Pupils are required to annotate the two population pyramids with the correct information, recap (slide 6). With reference to Zimbabwe and the United Kingdom population pyramids, pupils are required to write a paragraph describing the general trend of a population pyramid showing a LIC and a HIC.
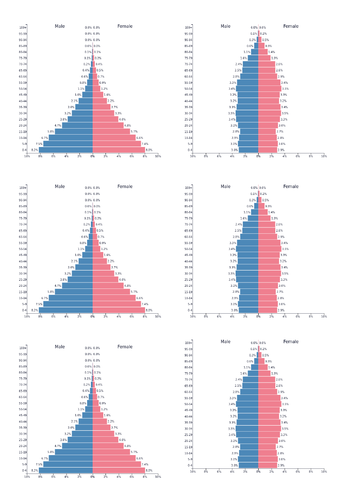
Discuss how population pyramid shapes can vary drastically based on a range of factors, refer to the four specific country examples (slide 9) Explore with pupils the reasons for why HICs have a narrow base, pupils can create a spider diagram discussing the reasons for why birth rates are low in countries such as the UK. As an extension, pupils can suggest reasons for why birth rates are high in LICs.
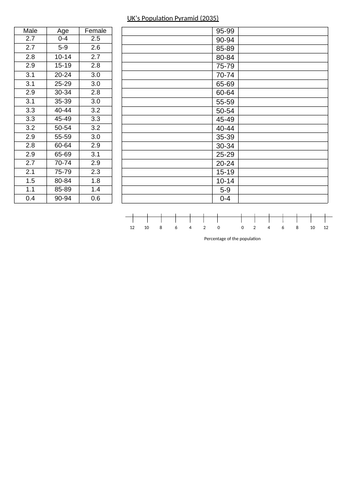
Pupils complete a quick true or false quick to check their understanding of population pyramids (slide 11). The homework task involves pupils drawing their own population pyramid, with annotations. Model an example of how the population pyramid should look (slide 13).
Something went wrong, please try again later.
This resource hasn't been reviewed yet
To ensure quality for our reviews, only customers who have purchased this resource can review it
Report this resourceto let us know if it violates our terms and conditions.
Our customer service team will review your report and will be in touch.
£3.00