


This lesson explains how probability § values can be assessed to determine significance and links are made to the null hypothesis and chi-squared test. The PowerPoint and accompanying resources have been designed to cover the content set out in the AQA A-level biology specification.
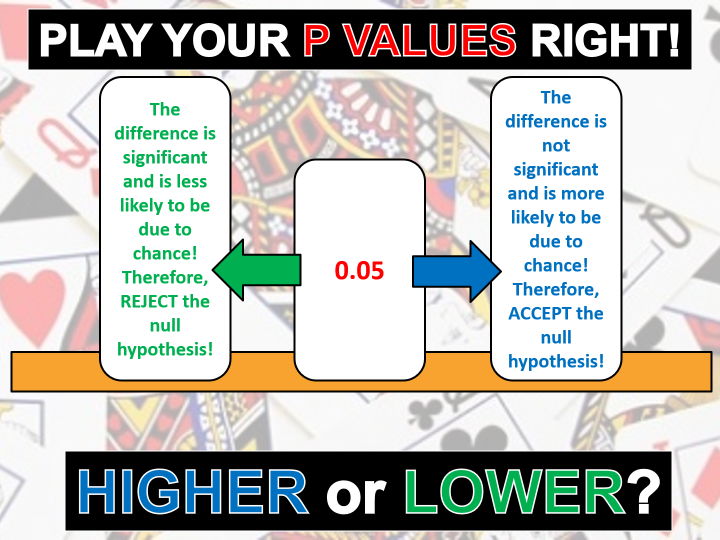
Students tend to struggle with the interpretation of the P values and so this lesson uses clear, concise explanations, a step-by-step guide and lots of modelling to demonstrate how to assess the values produced by statistical tests. The lesson begins by introducing the null hypothesis and the meaning of the P value of 0.05. An example exam question with a range of P values is used to explain the meaning of a value which is higher or lower than 0.05 in terms of significance and states how to use this to either accept or reject the null hypothesis. Students are then challenged to apply their understanding to another exam question and all answers are embedded into the PowerPoint. Moving forwards, students are introduced to the critical value table, and a step-by-step guide describes a comparison of the chi-squared value against the critical value allows significance to be determined and then how to work out the probability range at which the difference became significant. The lesson finishes with a series of exam questions to allow the students to assess their understanding.
Something went wrong, please try again later.
This resource hasn't been reviewed yet
To ensure quality for our reviews, only customers who have purchased this resource can review it
Report this resourceto let us know if it violates our terms and conditions.
Our customer service team will review your report and will be in touch.
£3.50