
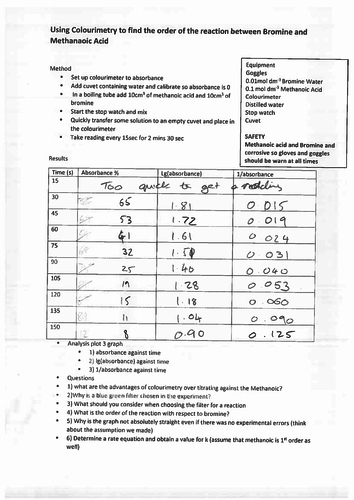
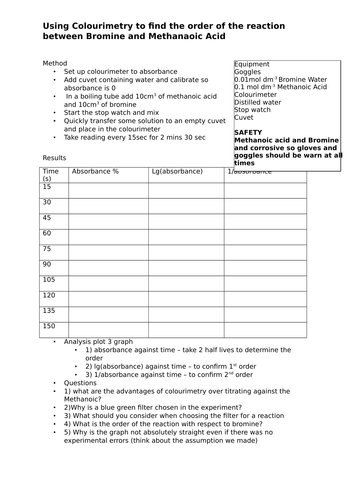
This is a powerpoint, worksheet and set of my results for decuing the order of Bromine in a reaction using colourimetry. This gives a clear outline of how to use colourimetry to monitor the progress of a reaction between bromine and methanoic acid. From the results students plot half life graphs and deduce that the reaction is 1st order with respect to bromine. There are also some follow up questions about the use of colourimetry with the answer. Included are the results from when I did the experiment.
Something went wrong, please try again later.
This resource hasn't been reviewed yet
To ensure quality for our reviews, only customers who have purchased this resource can review it
Report this resourceto let us know if it violates our terms and conditions.
Our customer service team will review your report and will be in touch.
£4.00