

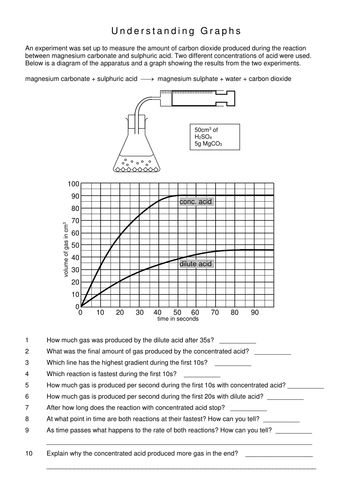
Using this simulation, written in excel, your students can explore the impact of surface area, temperature and concentration on reaction rate. As the conditions change, so the graph changes. When opening the spreadsheet, don't forget to click on "enable".
There is a worksheet for students to complete as they work through the activity.
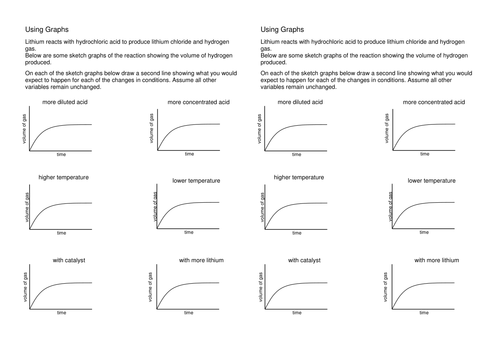
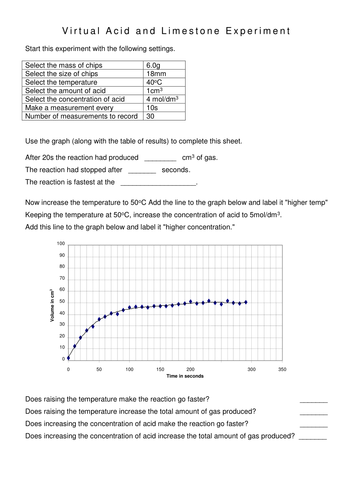
There are also two additional worksheets with further explore rates graphs and help students to deepen their understanding.
There is a worksheet for students to complete as they work through the activity.
There are also two additional worksheets with further explore rates graphs and help students to deepen their understanding.
Something went wrong, please try again later.
This resource hasn't been reviewed yet
To ensure quality for our reviews, only customers who have purchased this resource can review it
Report this resourceto let us know if it violates our terms and conditions.
Our customer service team will review your report and will be in touch.
£4.00