


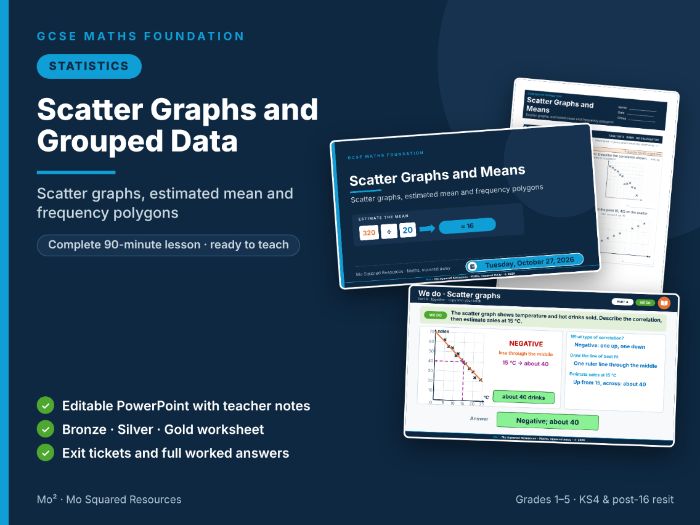
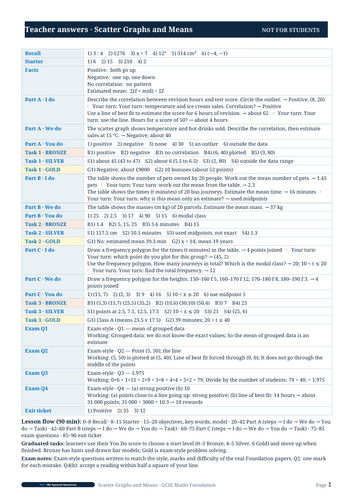
Scatter graphs, estimated mean and frequency polygons. A complete, ready-to-teach 90-minute lesson – download it and teach it, no preparation needed. Written for GCSE Foundation and post-16 resit learners (grades 1–3 aiming for a 4).
By the end of the lesson learners can: use a line of best fit to estimate, estimate a mean and draw a frequency polygon.
THE LESSON IN 3 PARTS
- Part A: Scatter graphs
- Part B: Estimated mean
- Part C: Frequency polygons
Key words: Correlation, Line of best fit, Outlier, Midpoint
WHAT YOU GET (4 files)
- PowerPoint – fully editable, with teacher notes, timings and common errors on every slide
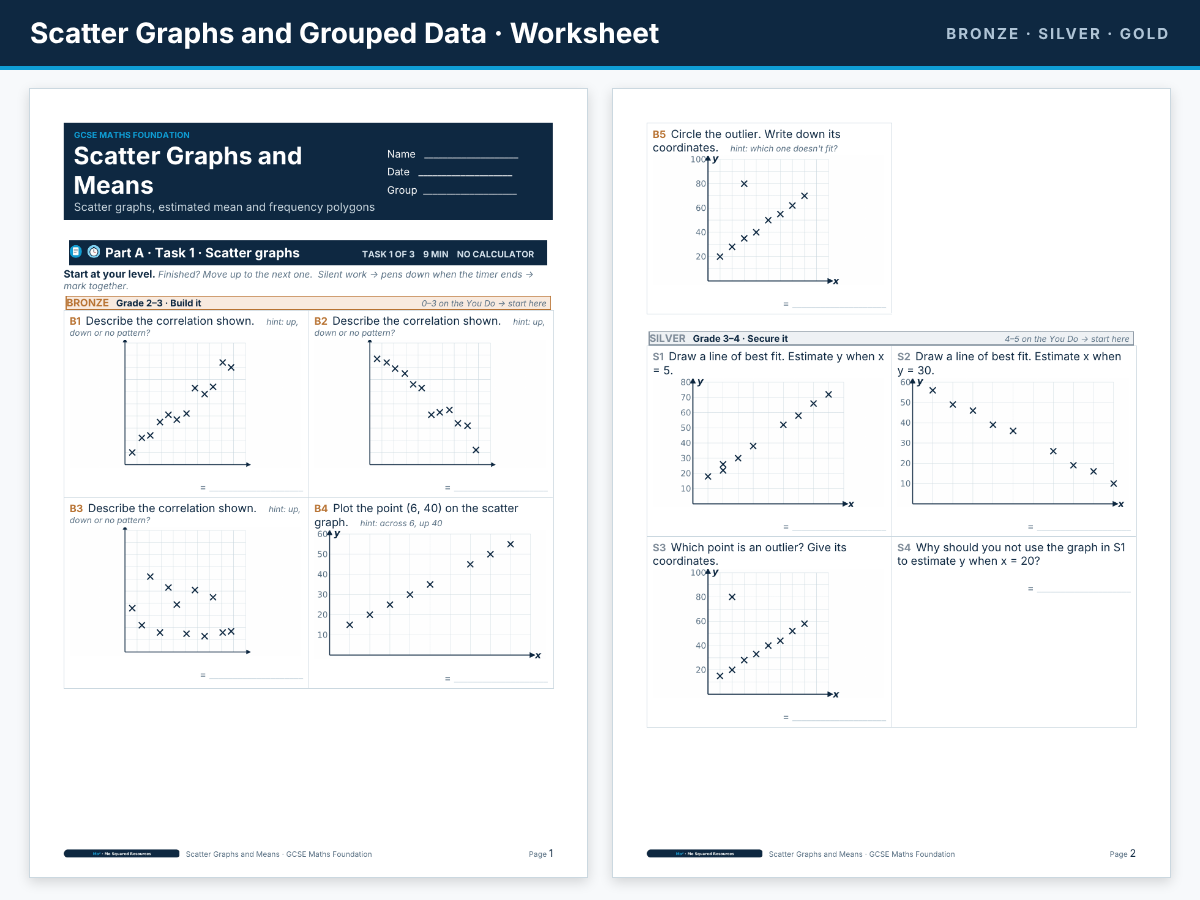
- Worksheet – Bronze (scaffolded, grade 2–3), Silver (grade 3–4) and Gold (exam-style, grade 4–5)
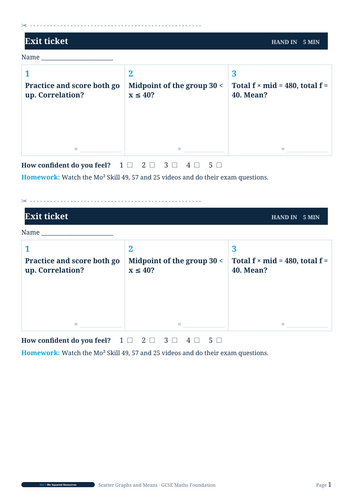
- Exit tickets – 3 per learner, print and cut
- Answers – full worked answers to every worksheet and exam question
- 31 worksheet questions across the three levels, plus 4 exam-style questions (1–4 marks, calculator and non-calculator)
HOW THE LESSON RUNS
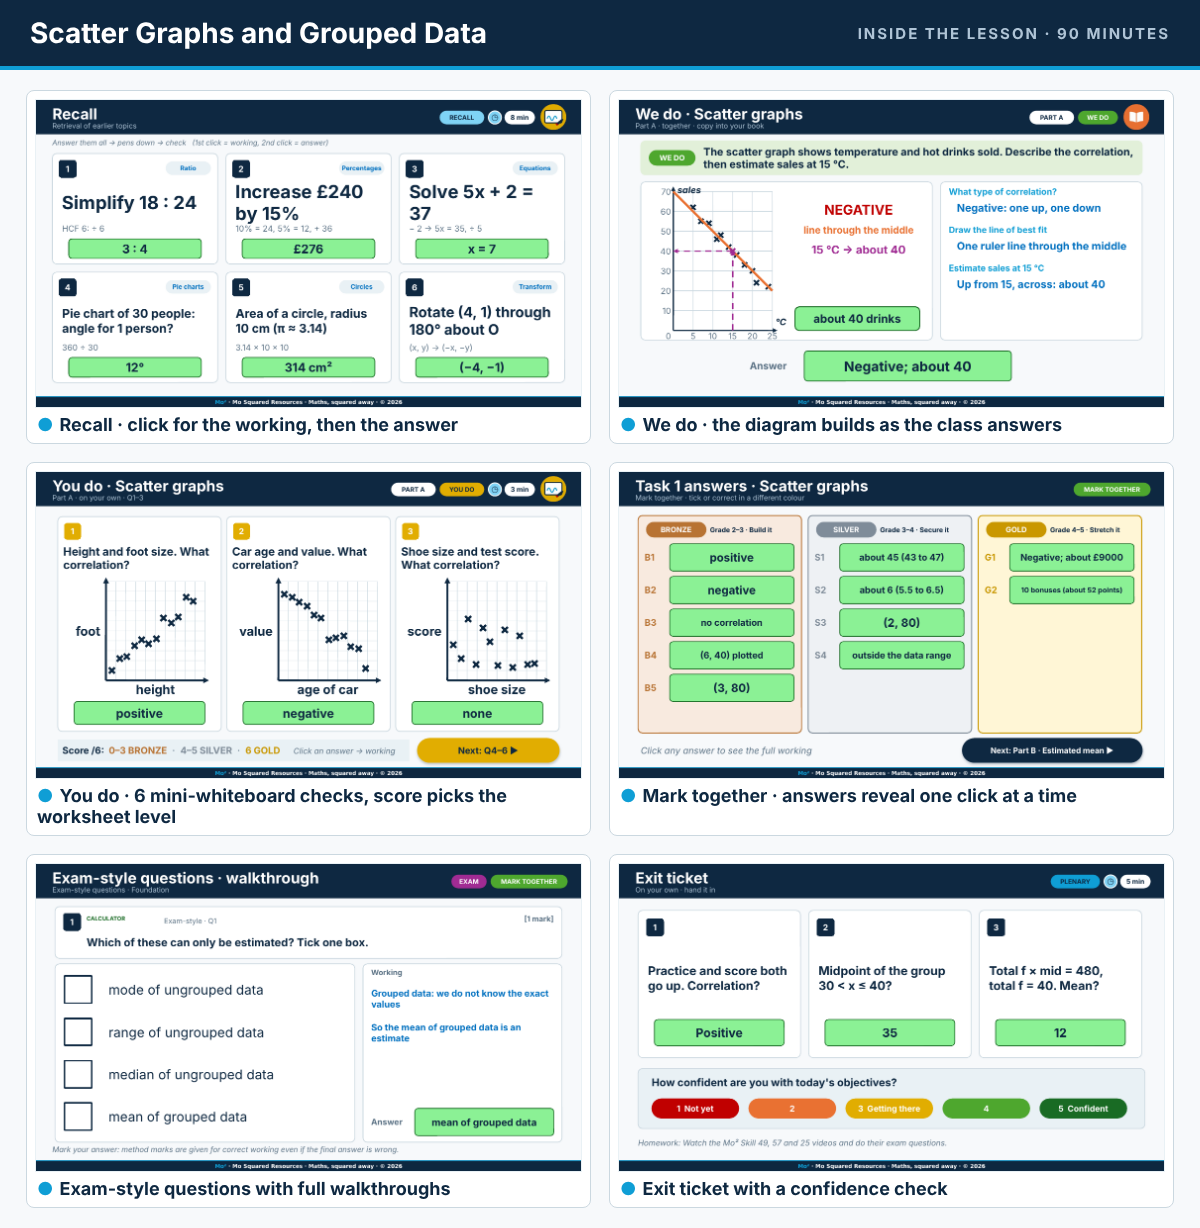
- Recall – 6 mini-whiteboard questions on earlier topics (click for working, click for answer)
- Starter – 4 questions on exactly the skills this lesson needs
- Objectives, key words and a one-slide fact sheet for exercise books
- For each part of the lesson:
- a step-by-step “How to” method slide
- I do – worked examples that build click by click as a diagram, then a “Your Turn” question for learners to try
- We do – one question worked through with the class
- You do – 6 mini-whiteboard check questions; click any answer to open the full worked solution. The score out of 6 tells each learner where to start on the worksheet
- a timed worksheet task slide with on-screen timer and click-to-reveal answers
- 4 exam-style questions with a full walkthrough of each
- Exit ticket with a confidence check, plus homework
WHY TEACHERS USE IT
- Less text, more visuals – every method is shown as a diagram (bar models, number lines, grids, labelled shapes)
- You control the pace – working and answers appear one click at a time
- Built-in differentiation – the mini-whiteboard score sends each learner to the right worksheet level
- All questions are original and exam-style; works for any GCSE Foundation specification
- The same routine every lesson, so learners know what to expect
Part of my complete GCSE Maths Foundation series (Statistics › Charts and Graphs). Save by buying the Charts and Graphs bundle or the Probability and Statistics unit bundle.
Get this resource as part of a bundle and save up to 43%
A bundle is a package of resources grouped together to teach a particular topic, or a series of lessons, in one place.
Bundle
Probability and Statistics – 7 GCSE Maths Foundation Lessons (Unit Bundle) with Worksheets & Answers
7 complete, ready-to-teach 90-minute GCSE Maths Foundation lessons covering the whole Probability and Statistics unit. Download and teach – no preparation needed. Written for GCSE Foundation and post-16 resit learners (grades 1–3 aiming for a 4). **LESSONS IN THIS BUNDLE** - Probability and Listing Outcomes - Venn and Tree Diagrams - Frequency Trees and Two-Way Tables - Averages and Range - Bar Charts, Pictograms and Line Graphs - Pie Charts - Scatter Graphs and Grouped Data **EVERY LESSON INCLUDES (4 files each)** - PowerPoint – fully editable, with teacher notes, timings and common errors on every slide - Worksheet – Bronze (scaffolded), Silver and Gold (exam-style) levels - Exit tickets – 3 per learner, print and cut - Answers – full worked answers to every worksheet and exam question **HOW THE LESSON RUNS** 1. Recall – 6 mini-whiteboard questions on earlier topics (click for working, click for answer) 2. Starter – 4 questions on exactly the skills this lesson needs 3. Objectives, key words and a one-slide fact sheet for exercise books 4. For each part of the lesson: - a step-by-step "How to" method slide - I do – worked examples that build click by click as a diagram, then a "Your Turn" question for learners to try - We do – one question worked through with the class - You do – 6 mini-whiteboard check questions; click any answer to open the full worked solution. The score out of 6 tells each learner where to start on the worksheet - a timed worksheet task slide with on-screen timer and click-to-reveal answers 5. 4 exam-style questions with a full walkthrough of each 6. Exit ticket with a confidence check, plus homework **WHY TEACHERS USE IT** - Less text, more visuals – every method is shown as a diagram (bar models, number lines, grids, labelled shapes) - You control the pace – working and answers appear one click at a time - Built-in differentiation – the mini-whiteboard score sends each learner to the right worksheet level - All questions are original and exam-style; works for any GCSE Foundation specification - The same routine every lesson, so learners know what to expect
£19.99
Bundle
Charts and Graphs – 3 GCSE Maths Foundation Lessons (Topic Bundle) with Worksheets & Answers
3 complete, ready-to-teach 90-minute GCSE Maths Foundation lessons on charts and graphs. Download and teach – no preparation needed. Written for GCSE Foundation and post-16 resit learners (grades 1–3 aiming for a 4). **LESSONS IN THIS BUNDLE** - Bar Charts, Pictograms and Line Graphs - Pie Charts - Scatter Graphs and Grouped Data **EVERY LESSON INCLUDES (4 files each)** - PowerPoint – fully editable, with teacher notes, timings and common errors on every slide - Worksheet – Bronze (scaffolded), Silver and Gold (exam-style) levels - Exit tickets – 3 per learner, print and cut - Answers – full worked answers to every worksheet and exam question **HOW THE LESSON RUNS** 1. Recall – 6 mini-whiteboard questions on earlier topics (click for working, click for answer) 2. Starter – 4 questions on exactly the skills this lesson needs 3. Objectives, key words and a one-slide fact sheet for exercise books 4. For each part of the lesson: - a step-by-step "How to" method slide - I do – worked examples that build click by click as a diagram, then a "Your Turn" question for learners to try - We do – one question worked through with the class - You do – 6 mini-whiteboard check questions; click any answer to open the full worked solution. The score out of 6 tells each learner where to start on the worksheet - a timed worksheet task slide with on-screen timer and click-to-reveal answers 5. 4 exam-style questions with a full walkthrough of each 6. Exit ticket with a confidence check, plus homework **WHY TEACHERS USE IT** - Less text, more visuals – every method is shown as a diagram (bar models, number lines, grids, labelled shapes) - You control the pace – working and answers appear one click at a time - Built-in differentiation – the mini-whiteboard score sends each learner to the right worksheet level - All questions are original and exam-style; works for any GCSE Foundation specification - The same routine every lesson, so learners know what to expect
£10.99
Something went wrong, please try again later.
This resource hasn't been reviewed yet
To ensure quality for our reviews, only customers who have purchased this resource can review it
Report this resourceto let us know if it violates our terms and conditions.
Our customer service team will review your report and will be in touch.
£4.99