
10 questions to keep your students busy.
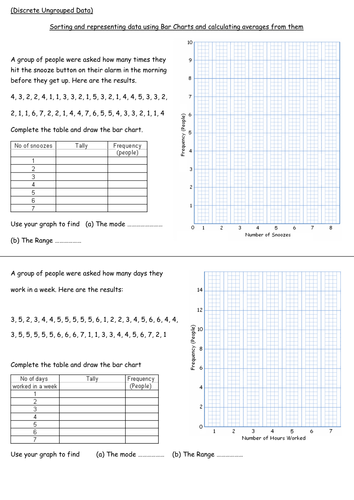
Students are to sort data into frequency tables, then draw a bar chart from the table. They are then to use the bar chart to find the mode and the range. These worksheets progress from ungrouped data to grouped data. The tables use tally charts to keep track of sorting. Excellent resource to use with any class.
Students are to sort data into frequency tables, then draw a bar chart from the table. They are then to use the bar chart to find the mode and the range. These worksheets progress from ungrouped data to grouped data. The tables use tally charts to keep track of sorting. Excellent resource to use with any class.
Something went wrong, please try again later.
Report this resourceto let us know if it violates our terms and conditions.
Our customer service team will review your report and will be in touch.
£3.00