
A presentation suitable for KS3 looking at working with graphs in spreadsheets. Presentation includes multi-choice questions to engage students and get them thinking about the subject throughout the presentation.
Learning Objective(s):
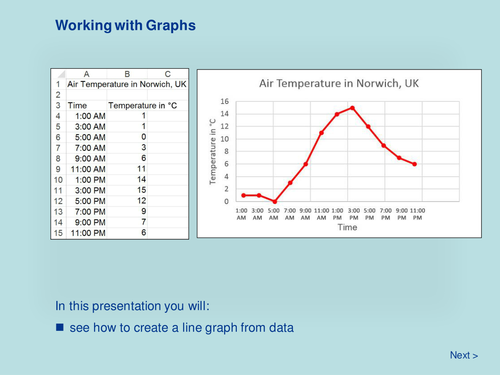
Identify how to create a line graph from data in a spreadsheet.
Main Skills: Interpret written text and diagrams.
Duration: Approximately 30 mins
18 slides covering:
• Axes
• Data
• Titles and Units
• Creating a Line Graph
• Formatting a Line Graph
• Printing a Line Graph
Learning Objective(s):
Identify how to create a line graph from data in a spreadsheet.
Main Skills: Interpret written text and diagrams.
Duration: Approximately 30 mins
18 slides covering:
• Axes
• Data
• Titles and Units
• Creating a Line Graph
• Formatting a Line Graph
• Printing a Line Graph
Something went wrong, please try again later.
This resource hasn't been reviewed yet
To ensure quality for our reviews, only customers who have purchased this resource can review it
Report this resourceto let us know if it violates our terms and conditions.
Our customer service team will review your report and will be in touch.
£1.00