
A double-sided PDF worksheet with questions and answers on Statistics. The worksheet has preparation questions for the student to complete before the topic is taught and topic questions to complete afterwards. Also included is a full marking grid so students have a gap-analysis of what they understand and what they need to improve.
Suitable for Year 6 Students.
The download includes the Questions PDF and the Answers PDF.
Strands included:
5S1 complete, read and interpret information in tables, including timetables
5S2 solve comparison, sum and difference problems using information presented in a line graph
6S1 interpret and construct pie charts and line graphs and use these to solve problems
6S3 calculate and interpret the mean as an average
Preparation Questions:
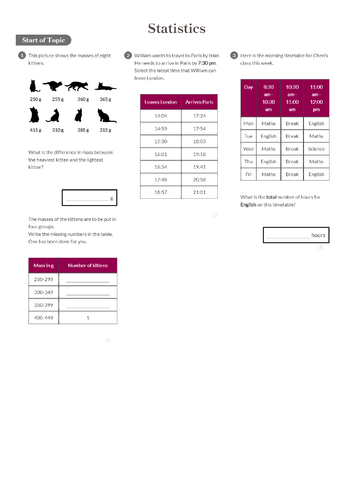
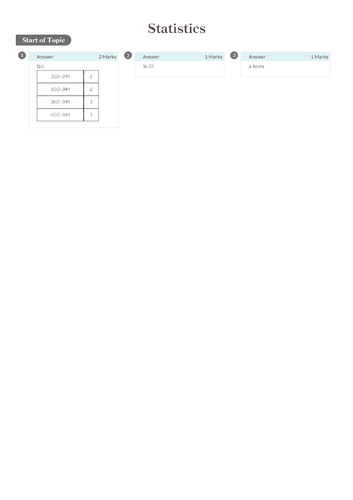
Find difference in mass of heaviest and lightest and group onto table
Find time to leave given arrival time using timetable
Find number of hours of English from class timetable
Analyse data of populations from 5 towns
Read bus timetable
Interpret line graph (car speed vs time)
Find difference between points on line graph (bird height vs time)
Find difference between two lines on same line graph (score vs time)
Find total amounts from line graph (population vs day of week)
Topic Questions:
Tick statements that are correct about a pie chart
Draw Pie Chart
Find Frequency From Pie Chart
Interpret Pie Chart
Compares Value On Two Graphs
Reading a line graph (without line) and calculating the mean
Find the mean price of tickets
Find Missing Number From Mean
Find new value given old mean and new mean of guinea pigs
Get this resource as part of a bundle and save up to 20%
A bundle is a package of resources grouped together to teach a particular topic, or a series of lessons, in one place.
Something went wrong, please try again later.
This resource hasn't been reviewed yet
To ensure quality for our reviews, only customers who have purchased this resource can review it
Report this resourceto let us know if it violates our terms and conditions.
Our customer service team will review your report and will be in touch.
£3.00