

T-Level Health 2023-2024 complete pick-up-and-run teaching package for B1.29 The normal expected ranges for physiological measurements, how to identify when physiological measurements fall outside the normal expected ranges in adults, including factors that can contribute to measurement outside of usual parameters, If you are following my SoW it is for weeks beginning 26th February 2024.
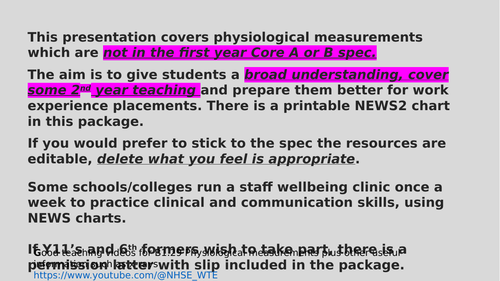
Please read carefully - This package covers physiological measurements which are not in the first year Core A or B spec. The aim is to give students a broad understanding, cover some 2nd year teaching and prepare them better for work experience placements. There is a printable NEWS2 chart in this package.
If you would prefer to stick to the spec the resources are editable, delete what you feel is appropriate.
There is a 104 slide presentation which you can stop-start, set slides as homework, encourages class discussions and has embedded YouTube clips to engage learners. Exam practice is embedded in the 30 page booklet with guided for note taking.
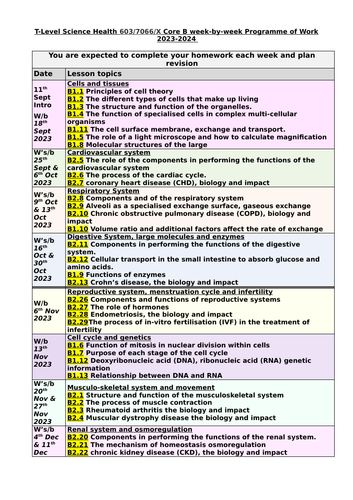
This package covers the below spec content;
B1.29 The normal expected ranges for physiological measurements, how to identify when physiological measurements fall outside the normal expected ranges in adults, including factors that can contribute to measurement outside of usual parameters:
• normal expected ranges for physiological measurements
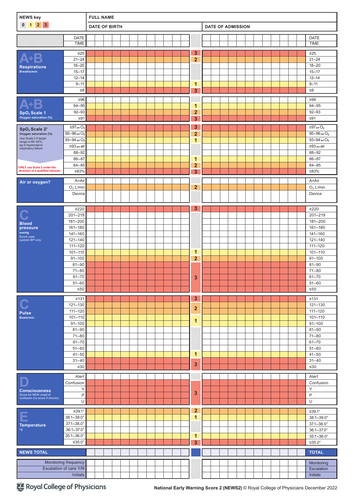
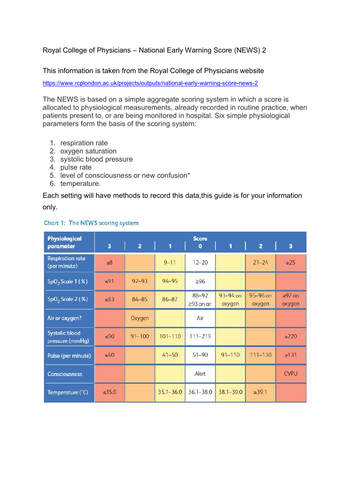
Physiological measurements Average range for an adult Physiological measurements Average range for an adult
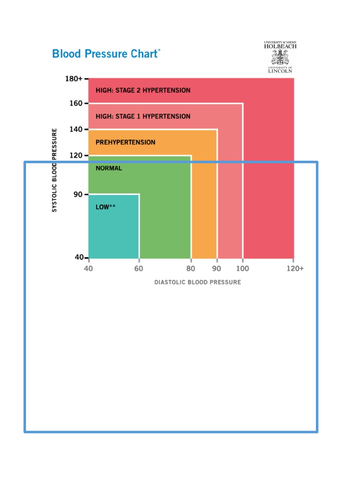
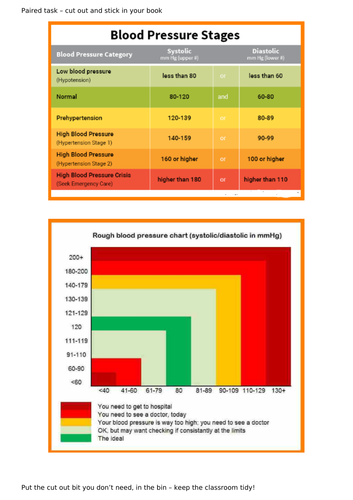
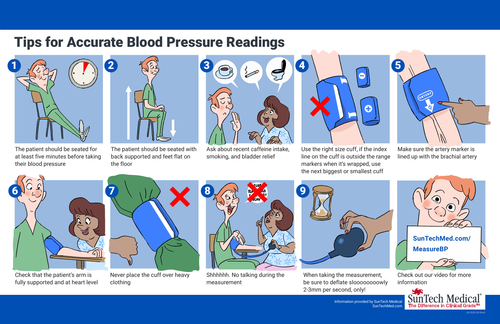
blood pressure systolic mm/hg:90–120 diastolic mm/hg:60–80
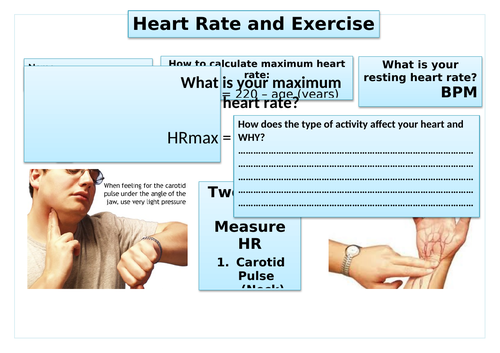
heart rate 60 to 100 beats per minute (bpm)
respiratory rate at rest 12 to 20 breaths per minute (bpm)
Temperature 36 to 37.5°C
• factors that contribute to measurements outside of normal parameters:
o age (variations in expected measurements for infants and children of different ages)
o weight
o exercise
o gender
o overall health
PLEASE LEAVE A REVIEW FOR THIS RESOURCE, THANK YOU
The hscresources TES shop has free and small charge teaching packages for all Health & Social Care and T-Level Health qualifications. It has a handy search facility to save on time.
You could join the biggest subject team, become a member of the Health and Social Care Resources Facebook group. There are now over 5,000+ teachers sharing ideas, resources, signposting and propping each other up!
Good luck in your teaching :-)
#hscresource #tlevelhealth
Something went wrong, please try again later.
This resource hasn't been reviewed yet
To ensure quality for our reviews, only customers who have purchased this resource can review it
Report this resourceto let us know if it violates our terms and conditions.
Our customer service team will review your report and will be in touch.
£10.00