

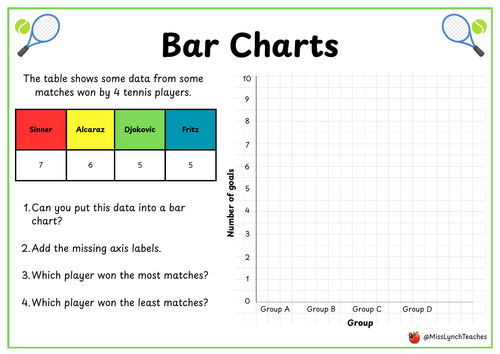

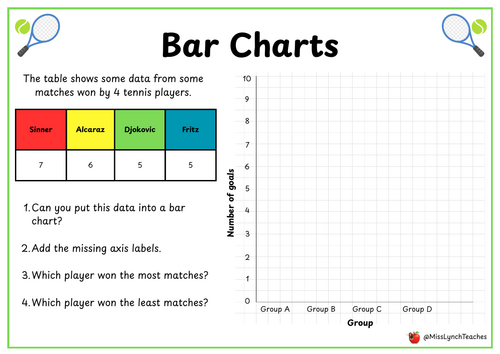
Make statistics engaging with this Wimbledon-inspired bar chart worksheet! Using real tennis player data, this activity helps pupils practise key data handling skills, including constructing bar charts, labelling axes, and interpreting results. With a sporting twist, it’s perfect for boosting engagement during Wimbledon season.
Learners will analyse matches won by top players, create their own bar chart, and answer reasoning questions to deepen their understanding.
What’s Included:
- Data table featuring tennis players (Sinner, Alcaraz, Djokovic, Fritz) and matches won
- Blank bar chart template to complete
- Questions on interpreting data and comparing values
- Challenges including identifying highest/lowest and spotting patterns
Perfect For:
- KS1 (year 2), KS2 / Year 3–5
- Maths lessons on statistics and bar charts
- Wimbledon or sports-themed learning
- Independent work, homework, or assessment tasks
wimbledon maths, bar chart worksheet ks2, tennis maths activity, data handling worksheet, statistics ks2, interpreting data worksheet, sports maths resource, year 4 bar charts, graphing worksheet printable, tennis themed learning, primary maths printable, ks2 statistics activity, bar chart practice, maths reasoning ks2, TES maths resource
Something went wrong, please try again later.
This resource hasn't been reviewed yet
To ensure quality for our reviews, only customers who have purchased this resource can review it
Report this resourceto let us know if it violates our terms and conditions.
Our customer service team will review your report and will be in touch.
£1.50