

Venn diagrams is new on the 1 - 9 GCSE spec this year and I have thought about a good solid constructive lesson that will win students understanding with this.
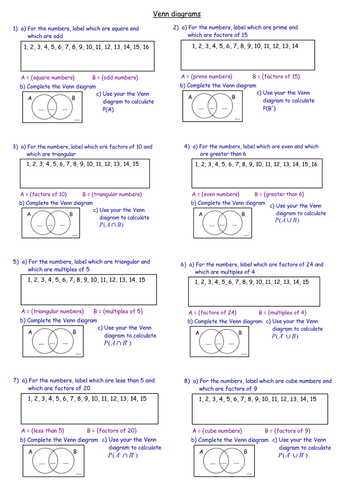
Firstly, I have based each question around two visual events (i.e. even numbers and prime numbers). The idea here is that students say which numbers are which and then place them into the Venn diagram. Then they are asked to calculate one probability question from it, they will struggle with this but that's where you step in to make sense of them with the example ready at the board. See the cover image as an example, I have made up 8 questions, each with a different probability.
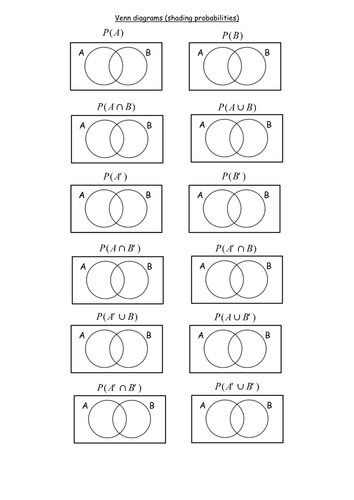
The lesson is an ActivInspire flipchart, explanations and answers. Students can work from a friendly worksheet. I have put in a suitable starter (listing multiple, factors, primes, cube numbers etc). I have also included in this lesson blank diagrams with the probabilities they need to be able to shade (answers included).
Firstly, I have based each question around two visual events (i.e. even numbers and prime numbers). The idea here is that students say which numbers are which and then place them into the Venn diagram. Then they are asked to calculate one probability question from it, they will struggle with this but that's where you step in to make sense of them with the example ready at the board. See the cover image as an example, I have made up 8 questions, each with a different probability.
The lesson is an ActivInspire flipchart, explanations and answers. Students can work from a friendly worksheet. I have put in a suitable starter (listing multiple, factors, primes, cube numbers etc). I have also included in this lesson blank diagrams with the probabilities they need to be able to shade (answers included).
Something went wrong, please try again later.
This resource hasn't been reviewed yet
To ensure quality for our reviews, only customers who have purchased this resource can review it
Report this resourceto let us know if it violates our terms and conditions.
Our customer service team will review your report and will be in touch.
£3.00