
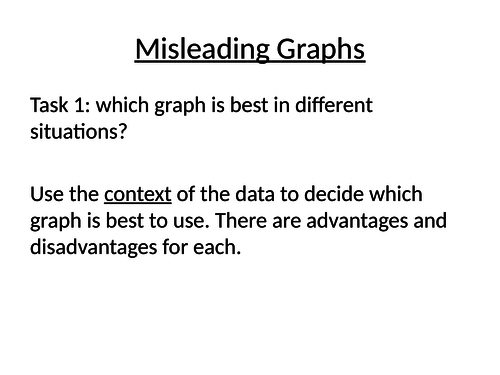
An activity where students must decide which graph is best to represent different types of data (comparing bar graphs, line graphs and pie charts). A great opportunity to help students get into the habit of justifying their answers with mathematical reasoning.
Something went wrong, please try again later.
This resource hasn't been reviewed yet
To ensure quality for our reviews, only customers who have purchased this resource can review it
Report this resourceto let us know if it violates our terms and conditions.
Our customer service team will review your report and will be in touch.
£1.00