


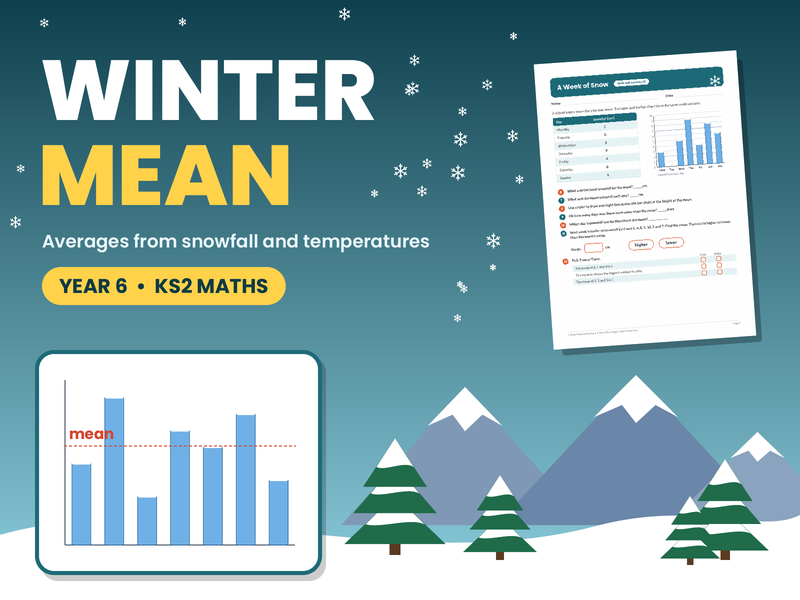
How much snow falls on an average day? This Year 6 maths pack teaches the mean as an average with winter data. Pupils learn the three steps (add, count, divide) from a worked example with a bar chart, find the mean of five sets of snowfall, temperature and sales data, read a week of snowfall from a table and a bar chart, find a missing value, compare two weeks of temperatures and solve problems.
What is included (6 A4 pages, numbered as printed in the footers):
• Page 1: teacher front page with learning objectives, National Curriculum link (Year 6 Statistics) and teaching notes.
• Page 2: What Is the Mean? Three steps, a worked example with a bar chart and a dashed mean line, and five sets of data to find the total and the mean of.
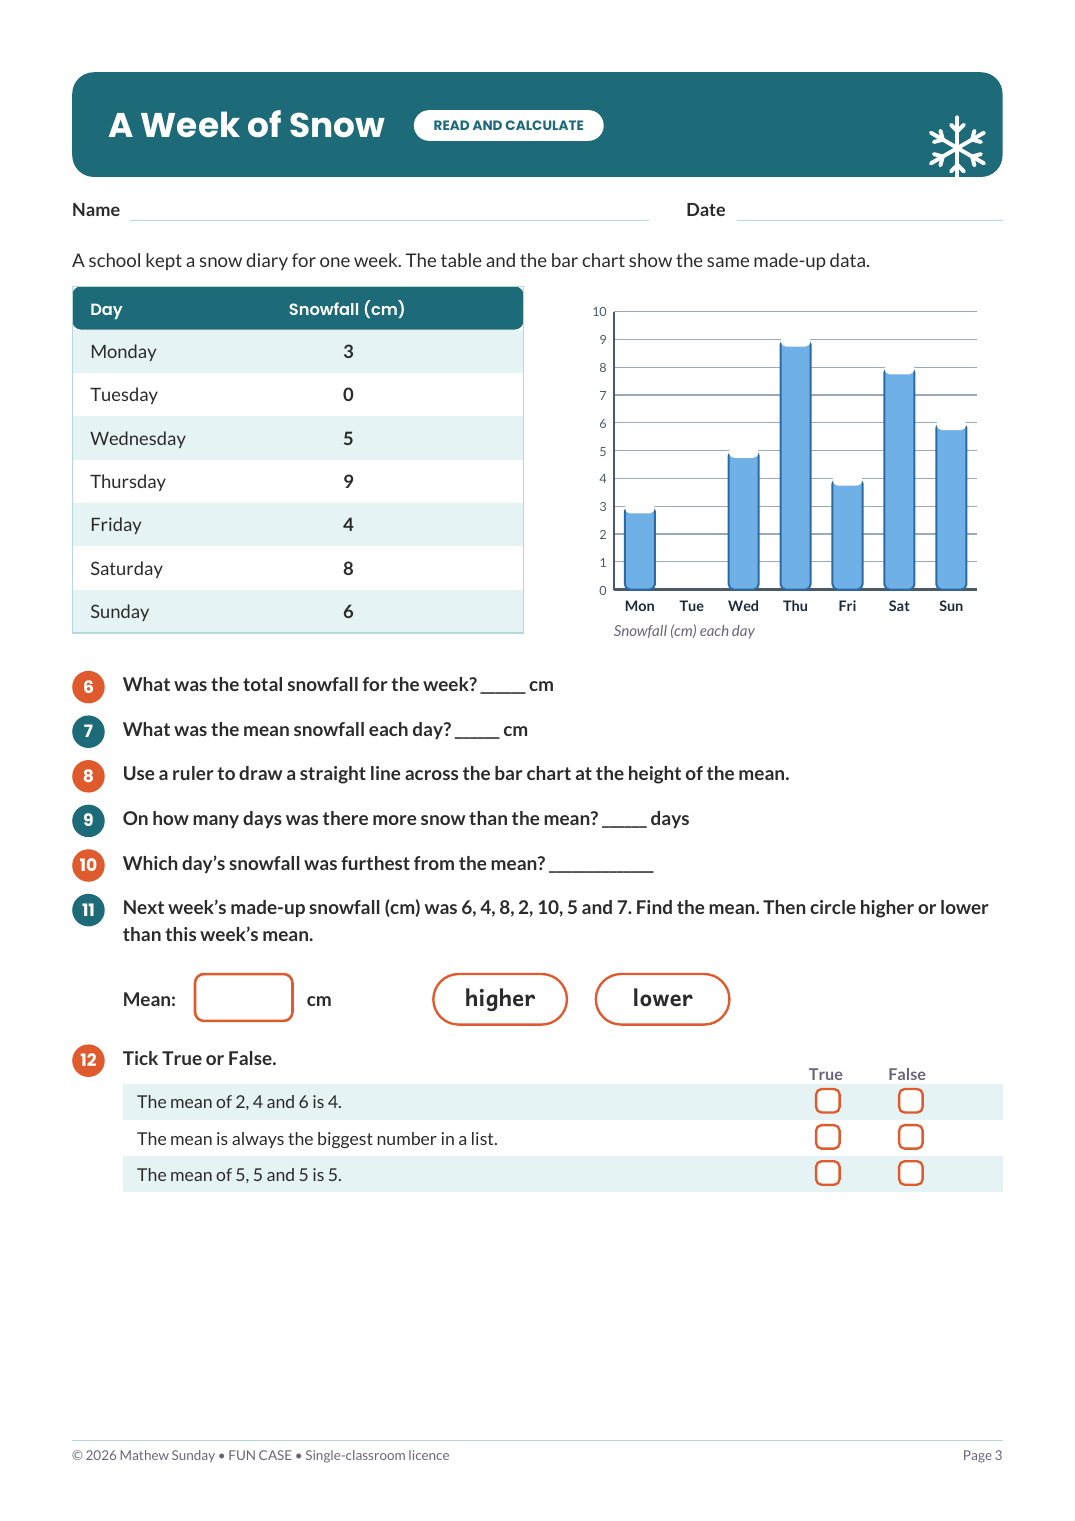
• Page 3: A Week of Snow. A made-up snow diary as a table and a bar chart, with questions on the total, the mean, drawing the mean on the chart, days above the mean, the day furthest from the mean, next week’s mean and a true or false table.
• Page 4: Mean Problems. A missing-value problem, two weeks of temperatures to compare, a total from a mean, a reason question and a challenge.
• Page 5: answer key.
• Page 6: a FUN CASE thank-you page.
All the data is made up for practice and is labelled as made up. Every mean is a whole number, so there is no rounding. Written in British English for England. About 45 minutes. Good for a Year 6 maths lesson on statistics, a winter topic, homework, revision, early finishers or cover work. Pupils can write on the sheets or answer orally.
One non-editable PDF. All drawings and the questions are original. Single-classroom licence.
Something went wrong, please try again later.
This resource hasn't been reviewed yet
To ensure quality for our reviews, only customers who have purchased this resource can review it
Report this resourceto let us know if it violates our terms and conditions.
Our customer service team will review your report and will be in touch.
$2.00