


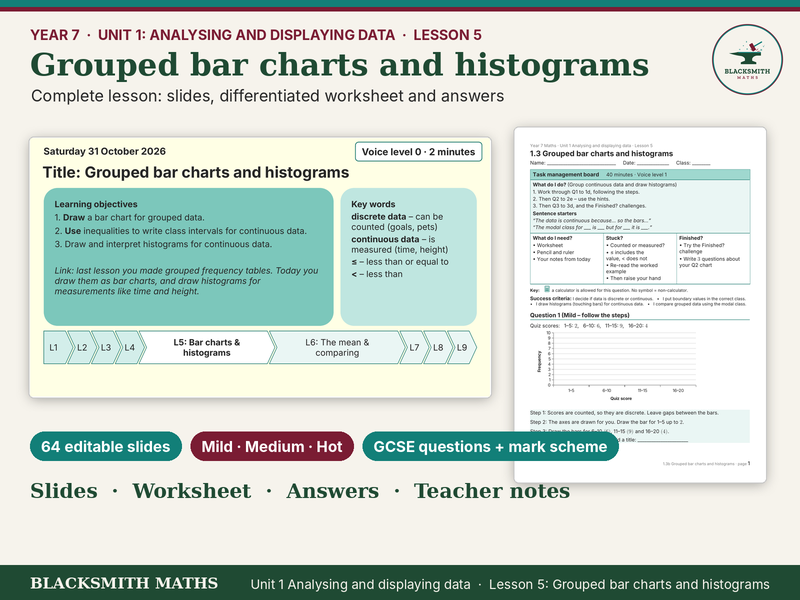

Year 7 Maths: Grouped bar charts and histograms (Unit 1 Analysing and displaying data, Lesson 5) – Complete Lesson, Worksheet & Answers
SHORT SUMMARY (resource summary box)
A complete, fully editable Year 7 lesson on grouped bar charts and histograms: 59 teaching slides, a differentiated Mild/Medium/Hot worksheet with 13 questions, 5 GCSE-style exam questions with a mark scheme, and full answers.
DESCRIPTION
Students draw bar charts for grouped data, write class intervals with inequalities, and draw and read histograms with unequal class widths using frequency density. Frequency density is GCSE Higher content, so this lesson also works as stretch or as a Year 10/11 introduction.
Learning objectives
• Draw a bar chart for grouped data
• Use inequalities to write class intervals for continuous data
• Draw and interpret histograms for continuous data
What’s included
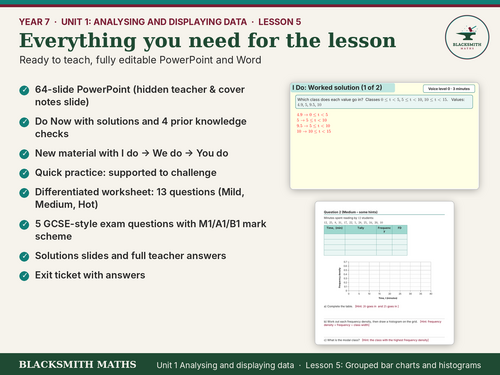
• PowerPoint: 59 teaching slides plus hidden teacher and cover notes and optional “more practice” slides
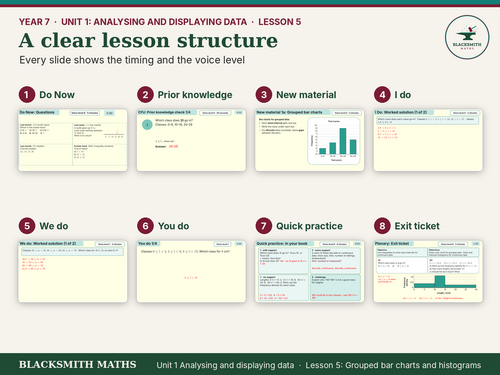
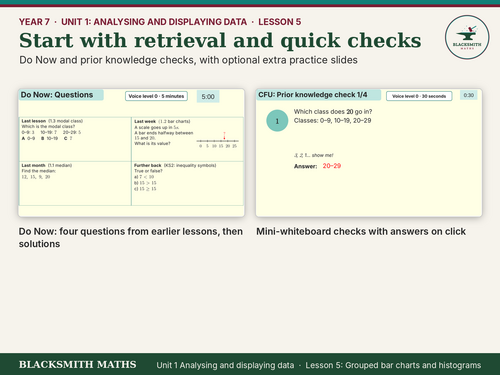
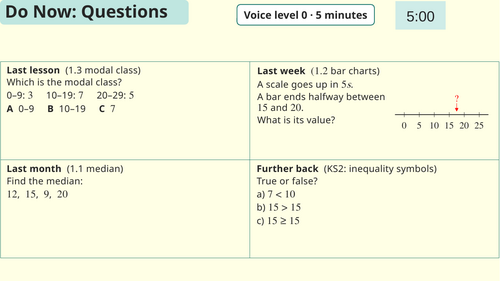
• Do Now (four retrieval questions from earlier topics) with solutions
• Prior knowledge checks for mini-whiteboards, with answers on click
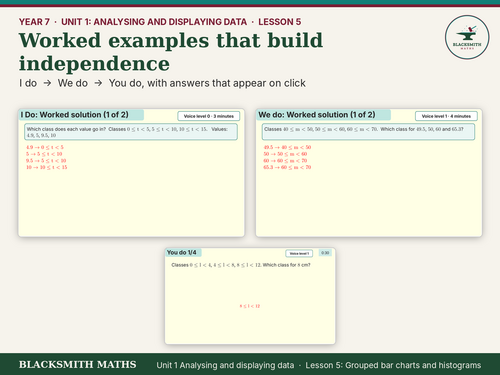
• New material followed by I do → We do → You do for each key idea (You do slides have 30-second timers)
• Quick practice in books, from fully supported to challenge
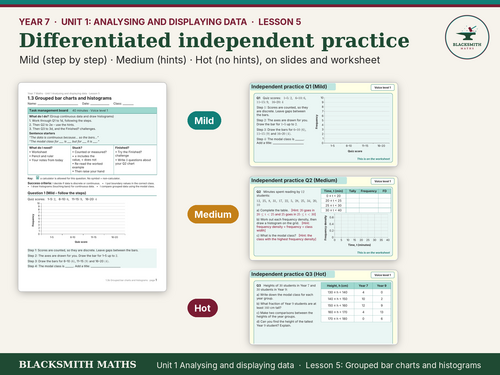
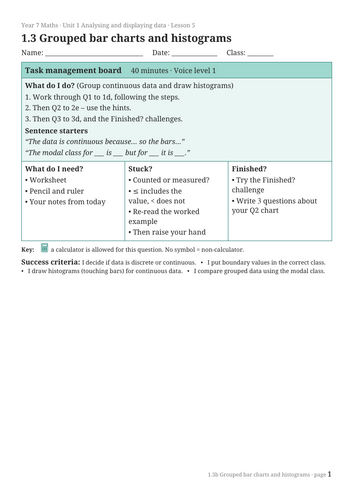
• Differentiated worksheet (Word): 13 questions across Mild (step-by-step), Medium (hints) and Hot (no hints), plus Finished? extension challenges
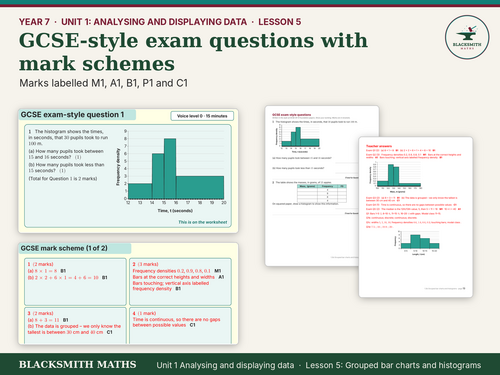
• 5 GCSE-style exam questions with a mark scheme labelled M1, A1, B1, P1 and C1
• Solutions slides after every level, and full teacher answers at the back of the worksheet
• Exit ticket with answers
Why teachers like it
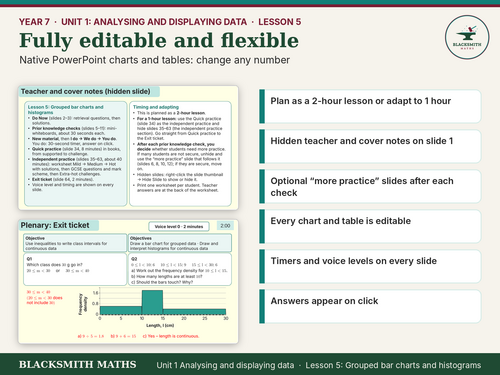
• Planned as a 2-hour lesson, easy to cut to 1 hour (instructions on the hidden teacher slide)
• Every chart, table, tally chart and pictogram is native and editable: change the numbers in seconds
• Timings and voice levels on every slide; answers appear on click
• Algebra and fractions written as proper equations; clear, consistent design
• Cover-friendly: a non-specialist can follow the teacher notes
Part of the Year 7 Unit 1 Analysing and displaying data series (9 lessons).
Something went wrong, please try again later.
This resource hasn't been reviewed yet
To ensure quality for our reviews, only customers who have purchased this resource can review it
Report this resourceto let us know if it violates our terms and conditions.
Our customer service team will review your report and will be in touch.
£1.00