


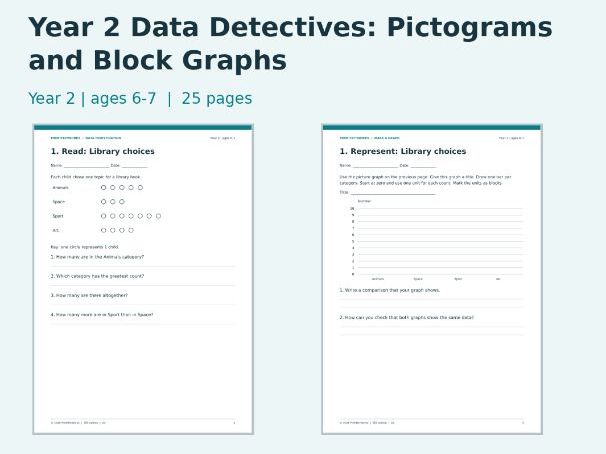
Practise Year 2 data handling with pictograms, block graphs, tally activities and classroom surveys. Includes worked examples and teacher answers.
WHAT IS INCLUDED
• Four supplied data sets with eight read-and-represent activity pages.
• Four two-page classroom surveys.
• A tally lesson.
• Two error investigations.
• A separate extension where each symbol represents two.
• Worked examples, teacher answers and checking guidance for open-ended surveys.
SKILLS COVERED
Read and represent data using pictograms and block graphs, record tallies, compare categories and identify mistakes.
Core graphs use single-unit scales and up to four categories. Each classroom survey uses up to ten participants.
HOW TO USE
Begin with the worked examples, then choose activities according to pupils’ taught skills. Use the supplied data sets for graph-reading and drawing practice, followed by classroom surveys to collect and represent pupils’ own data.
Discuss the error investigations together. Use the two-per-symbol extension when pupils are ready to explore a different key.
SUITABILITY
Designed for Year 2 pupils, typically aged 6–7. This is a classroom practice resource, not a standardised assessment or a complete teaching programme.
FORMAT
25 pages in total, including the cover, teacher guidance and answers. Printable A4 PDF in British English. Not editable.
The preview contains selected sample pages. No external paid resources are required.
Something went wrong, please try again later.
This resource hasn't been reviewed yet
To ensure quality for our reviews, only customers who have purchased this resource can review it
Report this resourceto let us know if it violates our terms and conditions.
Our customer service team will review your report and will be in touch.
£3.50