


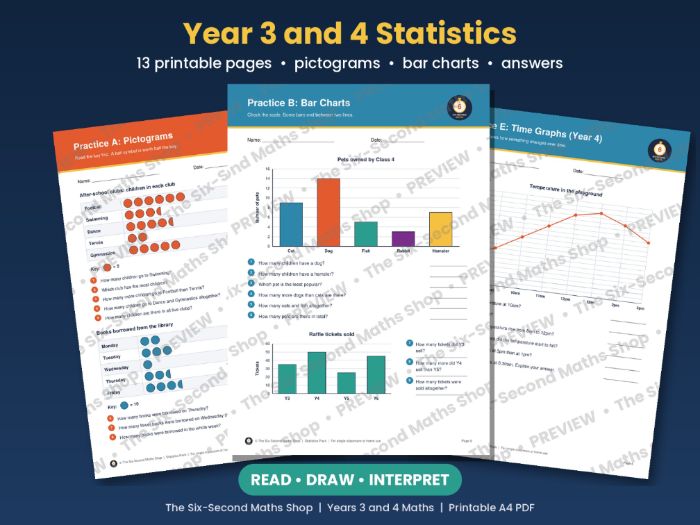
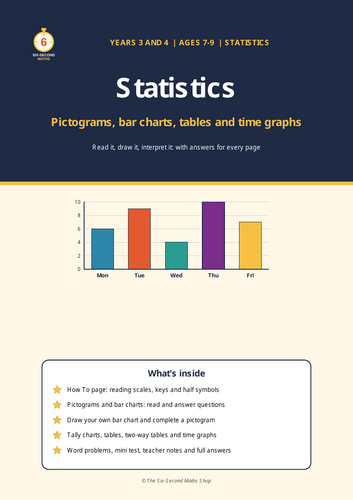
Statistics worksheets for Year 3 and Year 4: pictograms, bar charts, tally charts, tables, two-way tables and time graphs, with full answers. 13 printable A4 pages covering reading, drawing and interpreting data.
What’s inside:
- Teacher and parent notes with National Curriculum links
- How To page: reading keys, half symbols and scales that go up in 2s, 5s and 10s
- Practice A: pictograms with half symbols (key of 2 and 10)
- Practice B: scaled bar charts with how many more / fewer / altogether questions
- Practice C: draw your own bar chart and complete a pictogram
- Practice D: tally charts and a two-way table with missing numbers
- Practice E: time graphs (Year 4) with temperature over a day
- 8 word problems
- 10-question mini test (use before and after teaching)
- Full answer key
Covers Year 3 (bar charts, pictograms and tables) and Year 4 (discrete and continuous data, time graphs). Ideal for lessons, homework, intervention or assessment. Instant PDF download, print and go.
Get this resource as part of a bundle and save up to 50%
A bundle is a package of resources grouped together to teach a particular topic, or a series of lessons, in one place.
Something went wrong, please try again later.
This resource hasn't been reviewed yet
To ensure quality for our reviews, only customers who have purchased this resource can review it
Report this resourceto let us know if it violates our terms and conditions.
Our customer service team will review your report and will be in touch.
£2.00