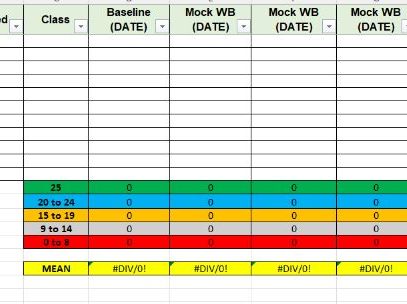
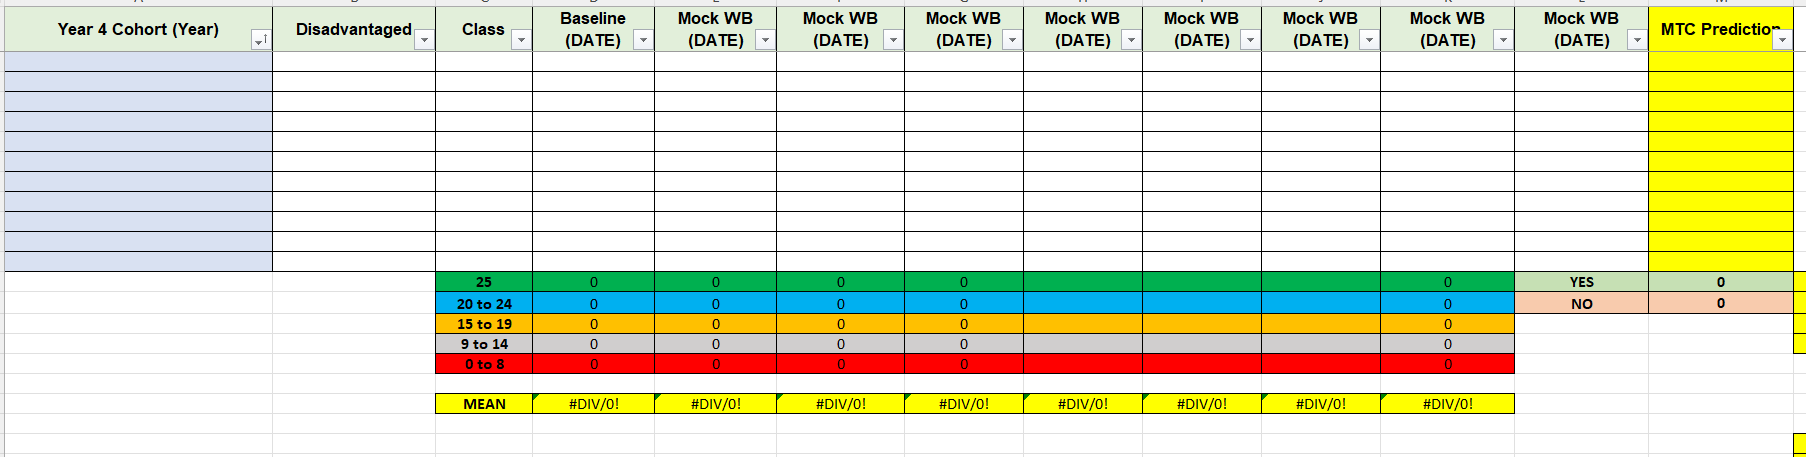
This document tracks children’s Multiplication Tables Check scores throughout the year with sections for: disadvantaged, baseline scores, continual checks throughout the year and predictions. This also calculates the number fo children falling within brackets of 25, 20-24, 15-19, 9-14 and 0-8. This also calculates the average scores for each assessment for your tracking and monitoring purposes.
Something went wrong, please try again later.
This resource hasn't been reviewed yet
To ensure quality for our reviews, only customers who have purchased this resource can review it
Report this resourceto let us know if it violates our terms and conditions.
Our customer service team will review your report and will be in touch.
£3.00