


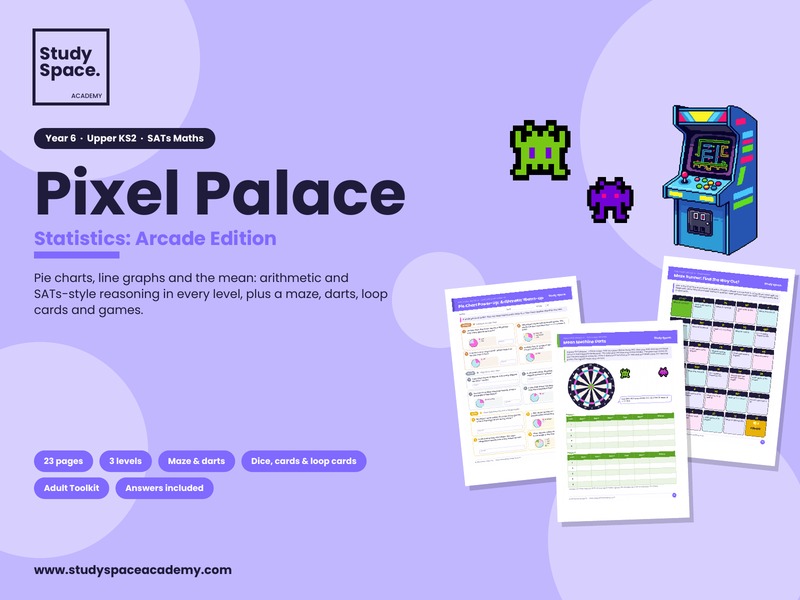
nsert coin and press start! Zap the green alien guides Year 6 kids through every Statistics objective at Pixel Palace Arcade, while Blip’s glitchy maths gives them mistakes to spot and fix.
Objectives covered (Year 6 Statistics)
Interpret and construct pie charts and line graphs and use these to solve problems
Calculate and interpret the mean as an average
What’s inside (23 pages)
Cover
Adult Toolkit (2 pages): worked examples for each objective, teaching tips, common mistakes, where to start, session plans and printing notes
Welcome to Pixel Palace: arcade floor map with a stamp for every level
Level 1 Pie Chart Power-Up: warm-up with pie charts (12 Qs, Bronze/Silver/Gold), problem solving (6 SATs-style Qs including drawing a pie chart), Dice Data Pie game
Level 2 Line Graph Racer: warm-up with three line graphs (12 Qs), problem solving over 2 pages (6 Qs including plotting a graph and a conversion graph), High Score Line playing-card graph game
Level 3 Mean Machine: warm-up (12 Qs), problem solving (6 Qs), Mean Machine Darts, 16 mean loop cards
Bonus Round: Maze Runner, Crack the Code (with decoy answers for self-checking), the Big Arcade Quiz (12 SATs-style multiple-choice Qs)
Progress tracker with “I can…” statements
Full answers
High Score Hero certificate
Thank-you page
Perfect for: Year 6 SATs revision, tutoring sessions, intervention groups, home learning and home education.
Something went wrong, please try again later.
This resource hasn't been reviewed yet
To ensure quality for our reviews, only customers who have purchased this resource can review it
Report this resourceto let us know if it violates our terms and conditions.
Our customer service team will review your report and will be in touch.
£5.00