
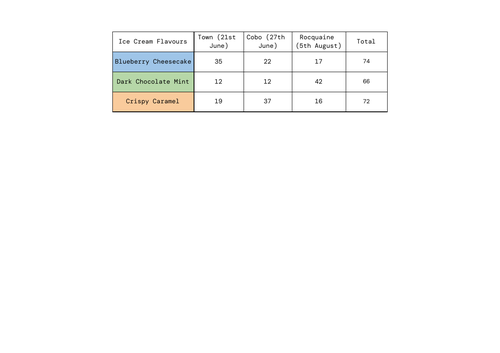
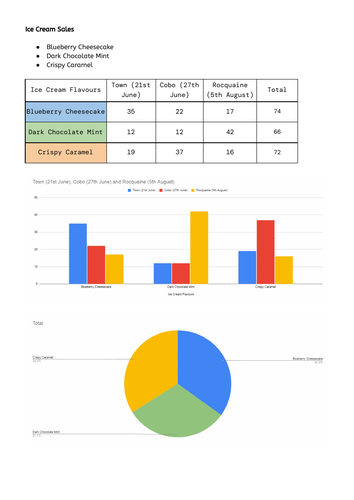
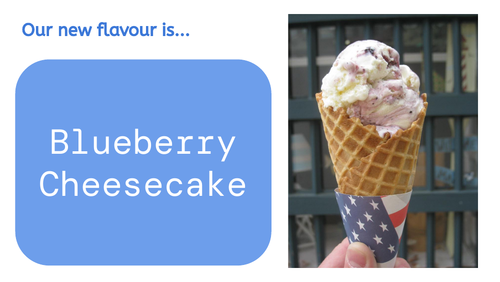
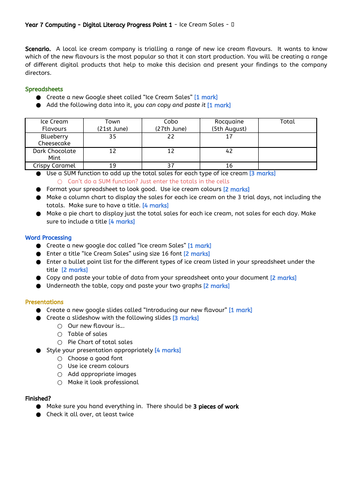
For Guernsey Ices’ latest project, the task involves utilizing a blend of digital skills to analyze and determine the most popular new ice cream flavor from a trial range. This assessment encompasses creating a detailed Google Sheet to record and calculate sales data across different locations and dates, employing functions to summarize total sales per flavor. Additionally, visual enhancements and charts are crafted to present the data attractively and informatively. A Google Doc is prepared to compile and list ice cream flavors, incorporating sales data and graphical analyses. Furthermore, a Google Slides presentation is developed to showcase the new flavor, incorporating sales tables, pie charts for total sales visualization, and professional styling to effectively communicate the findings to the company directors. This comprehensive approach ensures a thorough evaluation and presentation of consumer preferences, aiding Guernsey Ices in making an informed decision on their next production focus.
Get this resource as part of a bundle and save up to 33%
A bundle is a package of resources grouped together to teach a particular topic, or a series of lessons, in one place.
Bundle
Year 7 Digital Literacy Assessments
The assessments provided encompass a blend of creative design, digital document creation, and financial analysis tasks tailored for educational settings. Students are required to engage in logo design using specific color schemes and branding elements, format and analyze data within spreadsheets, create visually appealing and informative marketing presentations, and compile professional word-processed documents.
£10.00
Bundle
ALL KS3 Digital Literacy Assessments
The assessments provided encompass a blend of creative design, digital document creation, and financial analysis tasks tailored for educational settings. Students are required to engage in logo design using specific color schemes and branding elements, format and analyze data within spreadsheets, create visually appealing and informative marketing presentations, and compile professional word-processed documents. These tasks are aimed at enhancing students' skills in branding, digital literacy, data management, and professional communication, all while maintaining a consistent aesthetic and functional approach across various digital platforms.
£30.00
Something went wrong, please try again later.
This resource hasn't been reviewed yet
To ensure quality for our reviews, only customers who have purchased this resource can review it
Report this resourceto let us know if it violates our terms and conditions.
Our customer service team will review your report and will be in touch.
£5.00