

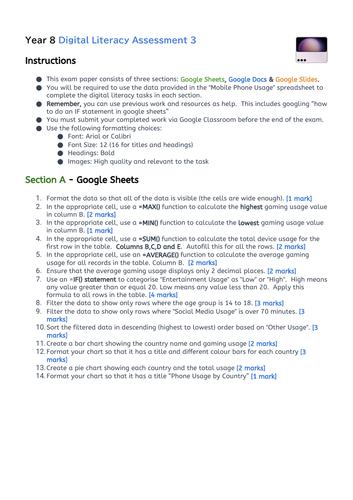
In the Year 8 Digital Literacy Assessment 3, students are tasked with utilizing data from the “Mobile Phone Usage” spreadsheet across three Google applications: Sheets, Docs, and Slides. The assessment begins with Google Sheets, where students format data for visibility, calculate highest and lowest gaming usage, total device usage, average gaming usage, and categorize entertainment usage using functions and filters. They are also required to create and format bar and pie charts reflecting usage statistics. In Google Docs, students must create a document to summarize their findings, including charts and explanations within a structured table. Finally, in Google Slides, they are to present their data and analysis through a presentation that includes data visualization, a collage of flags from the data set, and appropriate formatting throughout. Students must adhere to specific formatting guidelines for font, font size, and headings across all tasks. The assessment emphasizes the application of digital literacy skills in data analysis, presentation, and documentation, requiring thoroughness and attention to detail before submission via Google Classroom.
Get this resource as part of a bundle and save up to 33%
A bundle is a package of resources grouped together to teach a particular topic, or a series of lessons, in one place.
Bundle
Year 8 Digital Literacy Assessments
The assessments provided encompass a blend of creative design, digital document creation, and financial analysis tasks tailored for educational settings. Students are required to engage in logo design using specific color schemes and branding elements, format and analyze data within spreadsheets, create visually appealing and informative marketing presentations, and compile professional word-processed documents.
£10.00
Bundle
ALL KS3 Digital Literacy Assessments
The assessments provided encompass a blend of creative design, digital document creation, and financial analysis tasks tailored for educational settings. Students are required to engage in logo design using specific color schemes and branding elements, format and analyze data within spreadsheets, create visually appealing and informative marketing presentations, and compile professional word-processed documents. These tasks are aimed at enhancing students' skills in branding, digital literacy, data management, and professional communication, all while maintaining a consistent aesthetic and functional approach across various digital platforms.
£30.00
Something went wrong, please try again later.
This resource hasn't been reviewed yet
To ensure quality for our reviews, only customers who have purchased this resource can review it
Report this resourceto let us know if it violates our terms and conditions.
Our customer service team will review your report and will be in touch.
£5.00