International
Resources
Topical and themed
Pre-K and Kindergarten
Elementary
Middle school
High school
Special education
Education Jobs
Schools directory
News
Courses
Store
Resources
Education Jobs
Schools directory
News
Search
Tes for schools
Log in
Register
for free
Resources
Education Jobs
Schools directory
News
Magazine
Courses
Log out
Help
Home feed
My list
Courses
My Jobs
Job alerts
My CV
Career preferences
Resources
Author dashboard
Settings
Edit account
Log out
Home
Resources
Jobs
Schools directory
News
Magazine
Courses
Register for free
Log in
Help
Bruce Gray's resources
Add a resource
Edit shop
Average Rating
4.81
(based on 29 reviews)
Bruce Gray's resources
Average Rating
4.81
(based on 29 reviews)
Edit shop
Add a resource
51
Uploads
45k+
Views
29k+
Downloads
All resources
Mathematics
Computing
More
All resources
Lowest price
Relevance
Newest
Highest rated
Lowest price
MrGrayMaths
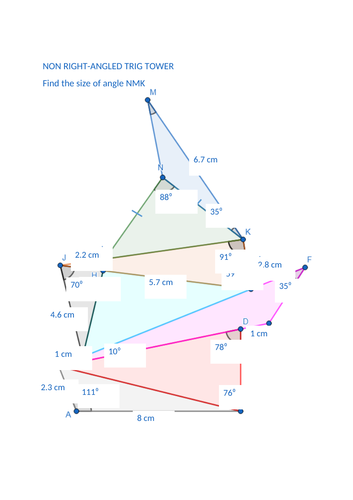
Sine and Cosine rule trigonometry pile up
(11)
MrGrayMaths
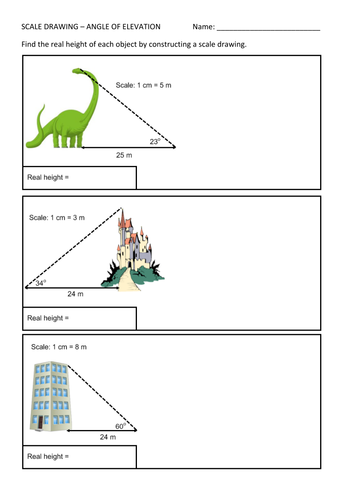
Angle of elevation / scale drawing worksheet
(2)
MrGrayMaths
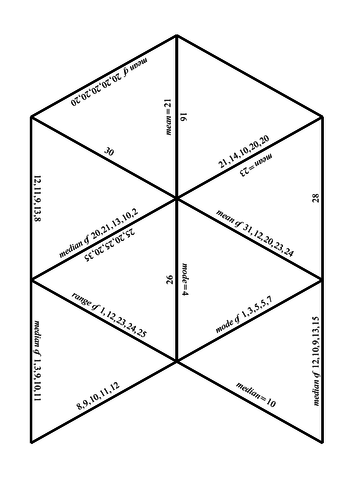
Averages and range jigsaw
(2)
MrGrayMaths
Solving Trigonometric Equations With Graphs
(1)
MrGrayMaths
Multiplying and dividing fractions using grids
(2)
MrGrayMaths
Higher Applications of Maths - Statistics and Modelling units
(0)
MrGrayMaths
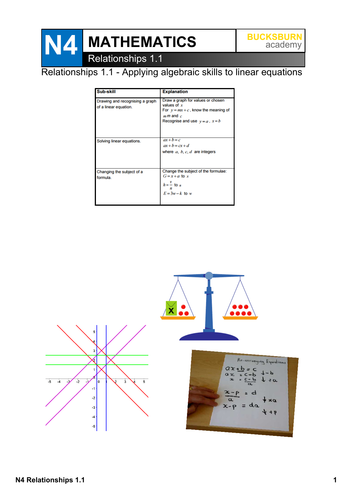
National 4 (N4) Mathematics: Relationships 1.1, 1.2, 1.3, 1.4 pupil notes
(2)
MrGrayMaths
Space Invaders and Tetris scale enlargement
(2)
MrGrayMaths
Higher Apps: Summarising data using a spreadsheet
(1)
MrGrayMaths
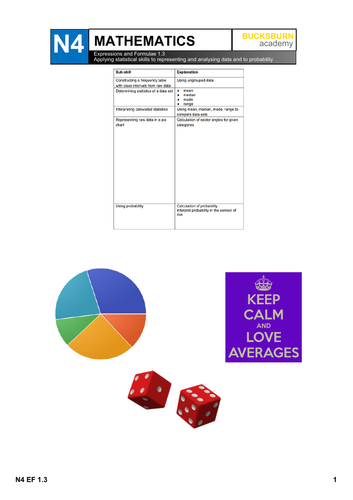
National 4 (N4) Mathematics: Expressions and Formulae 1.1, 1.2, 1.3 pupil notes
(1)
MrGrayMaths
Increasingly Difficult Exercise: Equation of a Cirlce (SQA Higher Maths)
(1)
MrGrayMaths
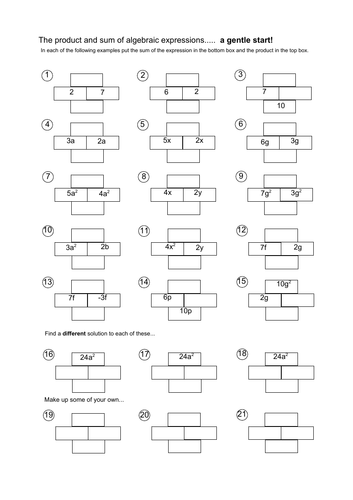
Product sum bricks
(0)
MrGrayMaths
National 5 (N5) Mathematics Vectors
(0)
MrGrayMaths
Translating with vectors SPACE INVADERS
(0)
MrGrayMaths
Higher Apps of Maths 2025 data booklet questions
(0)
MrGrayMaths
Calculating mean and range
(0)
MrGrayMaths
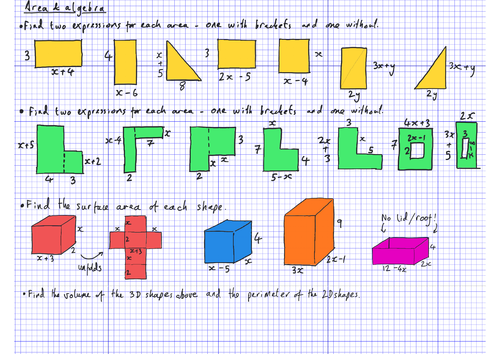
Area and algebra
(0)
MrGrayMaths
National 5 (N5) Mathematics Arcs and Sectors
(0)
MrGrayMaths
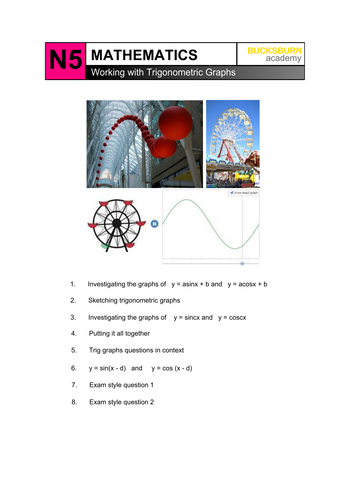
National 5 (N5) Mathematics Sketching Trigonometric Graphs
(0)
MrGrayMaths
Special numbers worksheet (square, triangular, Fibonacci, Pascal)
(0)
Previous
1
2
3
Next