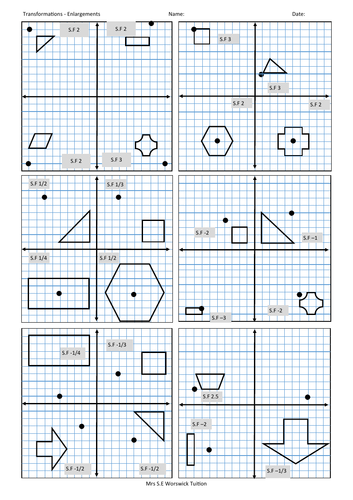
I created this worksheet as I could not find a suitable resource to use with my students. Designed to be used with high ability students who have not been taught (or don’t remember) being taught Enlargements. The first 8 questions practice the standard integer Enlargements. The next 4 questions are fractional Englargements. Then 4 questions on negative Enlargements. Then 4 questions on fractional negative Enlargements. The last 3 questions are a mix. Printed on 1 sheet of A4 with a boarder so could be cut down to stick into a classwork book. Personally I would use the first of the 4 questions as an example.
Exploring the song ‘Long Story Short’ by Taylor Swift
Possible uses
starter activity – Get students thinking about why a poet/author may have used certain language, what message they are trying to convey.
Revision – Poetry revision activity to check if students are applying the skills they have been taught.
Home-learning – A fun home-learning activity
Cover work
Directed Number and Fractional Thinking - White Rose Maths
Year 7, Spring 2, week 4 - 6
PowerPoint and Worksheet on representing Tenths and Hundredths on a number line.
Starter - Ordering Decimals
Activity 1 - Finding the missing numbers on a number line (Tenths and Hundredths)
Activity 2 - Placing numbers on a number line (Tenths and Hundredths)
place value table included designed to help support students to see the difference between digits in the Tenth and Hundredth columns.
Extension task: students find the number halfway between two numbers.
Four days of starter questions. Six questions each day.
Questions include percentage of an amount, percentage increase, percentage decrease, area of a trapezium, Expanding double brackets and changing the subject. Answers are included. Student can glue the sheet into their book and complete the questions at the start of the lesson whilst the teacher is settling the class.
An updated version is available https://www.tes.com/teaching-resource/-12745858
Constructing a frequency table is my most downloaded free resource. I have updated and improved this powerpoint.
Updated with data from 2020 and 2021. Now including answers.
Class example what is your favourite colour
Activity 1 - Data based on the 2021 European Athletics indoor Championships
drawing a ungrouped frequency table.
Activity 2 - Data based on the 2021 European Athletics indoor Championships
drawing a grouped frequency table.
Activity 3 - Activity 1 - Data based on the 2021 European Athletics indoor Championships
drawing a ungrouped frequency table
Activity 4 data from 2019/2020 football
drawing grouped frequency tables.
White Rose Maths - Year 7 - Spring 2 - Representing Tenths and Hundredths on number lines.
Powerpoint and Worksheet designed to teach students how to find missing fractions on a number line and to place fractions correctly on a number line.
Starter activity - Asks students to think about different ways fractions can be represented. The teacher can use this activity to address any misconceptions students may have such as how to write a fraction as a ratio. Student complete the answers on the worksheet.
Activity 2 - Discussion pairs/group to address misconceptions around fractions being equal parts.
Activity 3 - Discussion pairs/Group, how many parts are in a whole.
Activity 4 - Individual work, what fraction of the picture is shaded. Students complete the answers on the worksheet.
Check in question - Whole class. The teacher can assess which students have understood activity 4.
Activity 5 - Finding the missing numbers. Three examples on the powerpoint. Individual work on the worksheet.
Activity 6 - Placing fractions on a number line. One example on the powerpoint. Individual work on the worksheet.
Plenary Question - Discussion pairs/groups to address misconception around the size of the denominator and the size of the fraction.
Two worksheets with a total of 23 questions and solutions.
Students rotate the shapes around the given points.
Questions have been included in Publisher and PDF form.
I have also included the questions and solutions in a powerpoint.
Individual questions could be used should you wish to cover more than one transformation during the lesson
Suggest lesson plan
Students to receive a printed copy of worksheet 1
Teacher to print off slide 1 from the powerpoint
Teacher can demonstrate with a visualiser how to rotate the shapes.
Students can follow along
Students to complete the rest of the questions
Teacher can project solutions on to the board.
Both visual solutions and co-ordinates of the image have been included so that teachers can check the work of students without approaching their desks. Individual students can be asked to read out the sets of co-ordinates in order for the teacher check the students are completing the work correctly.
A simple worksheet designed for practice in working out and calculating with upper and lower bounds. I have included subtraction where students need to be told UB - LB and LB - UB and also division where students need to be informed to divide the LB by the UB and UB by the LB.
Answers are included as are worked solutions.
This flexible task can be completed by getting students to research Macroeconomics indicators or by using the data and graphs provided.
Lesson plan suggestion:
Lesson 1
Introduce the research task as homework or for a remote lesson or a lesson in a computer suite.
If students are struggling to find the data on the ONS website the links from the source section can be provide from the worksheet 2.6 Trends in Macroeconomics indicators - Data. Students should be encouraged to make there own line graphs.
Lesson 2
Students share their graphs with the class, has everyone used the same data? Are there different ways to measure these indicators?
Students who have not complete the task from the homework/lesson 1 or have used the wrong data should be provided with the graphs from the worksheet 2.6 Trends in Macroeconomics indicators - worksheet.
Student can then answer the questions. The questions have been provided with lines and without lines and in word and PDF format.
Lesson 3/homework
Students should now answer the same questions for other Economies using data from the IMF https://www.imf.org/en/Countries
Students could all pick different countries or be assigned different countries then share with other members of the class.
Constructing a frequency table is my most downloaded free resource. I have updated and improved this powerpoint.
Updated with data from 2021 and 2022. Including answers.
Class example what is your favourite colour
Activity 1 - Data based on the 2022 Commonwealth Games
drawing a ungrouped frequency table.
Activity 2 - Data based on the 2022 Commonwealth Games
drawing a grouped frequency table.
Activity 3 - Data based on the 2022 Commonwealth Games
drawing a grouped frequency tables
Activity 4 data from 2020/2021 football
drawing grouped frequency tables.
All data is included on the slide and also as a printable sheet. Full editable tables are included at the end of the powerpoint should you wish to adapt further.
This version has improved formatting.