These resources have been developed in line with the Pearson Scheme of Work. The key feature involves re-visiting previously taught topics in the context of the current topic, thus developing mathematical fluency and lessening the need for last ditch revision.
Fully worked, sequential examples run throughout each resource. Ideal for non-specialists as well as full blown mathematicians.
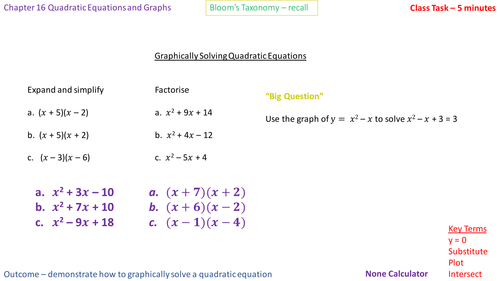
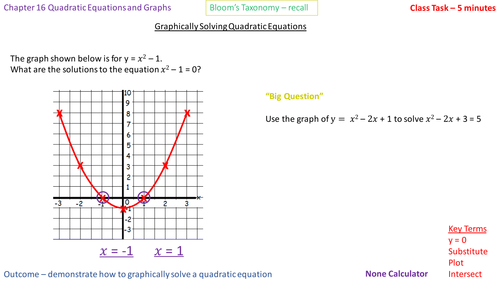
This two lesson pack contains lessons on graphically solving quadratic equations. By the end of the unit the students will have a fully embedded understanding of this topic.
This has been developed in line with the Pearson GCSE Foundation Scheme of Work. It is, however, suitable for use by those who do not use this exam board or who wish to use it with a younger, more able, class.
The first half of the PowerPoint contains:
* Worked examples (useful for non-specialists)
* An AFL example
* Classwork options (Grade 3, 4 or 5) for the teacher to choose to complete (answers included)
* In built revision through the inter-linking of previously taught topics
The second half of the PowerPoint contains:
* Worked examples embedding the newly taught topic in a different context
* An AFL example
* Classwork (answers included)
* In built revision through the inter-linking of previously taught topics
This is part of a set of PowerPoints that have been developed for this particular unit.
Other units will become available over time.
Are you a teacher who wants all of their lessons planned for them? Are you a head of maths who has to set a lot of cover work? Are you a senior leader who struggles to ensure consistency of teaching quality within you maths department? Do you have a lot of none specialists who will naturally have limitations in their mathematical knowledge? Are you a teacher who craves structure and full course content? If you answered yes to any of these then these resources are the ones for you. The lesson contains fully worked examples, differentiated questions and the application of the topic in a different context whilst also taking every opportunity to incorporate previously taught topics to consolidate the student's knowledge. Each lesson has been developed by a colleague who has successfully planned resources for his department of 10 where he was the only maths specialist! Within the space of three years he led the department to 81% A* - C (from 34%) with 79% (from 32%) expected progress. This has been maintained for the subsequent three years within a school containing 55% PP with students being significantly below the national average for ability on entry.
This has been developed in line with the Pearson GCSE Foundation Scheme of Work. It is, however, suitable for use by those who do not use this exam board or who wish to use it with a younger, more able, class.
The first half of the PowerPoint contains:
* Worked examples (useful for non-specialists)
* An AFL example
* Classwork options (Grade 3, 4 or 5) for the teacher to choose to complete (answers included)
* In built revision through the inter-linking of previously taught topics
The second half of the PowerPoint contains:
* Worked examples embedding the newly taught topic in a different context
* An AFL example
* Classwork (answers included)
* In built revision through the inter-linking of previously taught topics
This is part of a set of PowerPoints that have been developed for this particular unit.
Other units will become available over time.
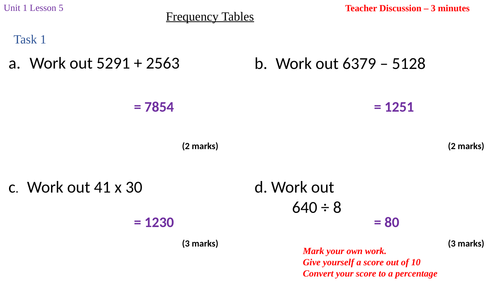
Frequency Tables (Y7 Theta Edexcel 5 Year SOW U1 L5) is a resource developed in line with the ‘Theta’ pathway. This lesson deals with interpreting frequency tables and also how to represent a data set within a frequency table.
This is part of a full unit of resourced lessons for the unit entitled ‘Analysing and Displaying Data’.
This resource contains:
Examples for the teacher to go through
Progressively written questions that develop challenge and promote problem solving throughout
AFL is fully embedded throughout the resource
This would be ideal for a teacher who is looking to cut down on workload, a non-specialist, or a leader of a department who wishes to improve practice of others within their team.
This bundle contains a full series of lessons covering the first unit (analysing and displaying data) from the year 7 aspect of the Edexcel 5 year GCSE.
Each lesson is complete with teacher led examples, AFL opportunities and thoughtfully put together questions that allow for progressively more difficult levels of challenge.
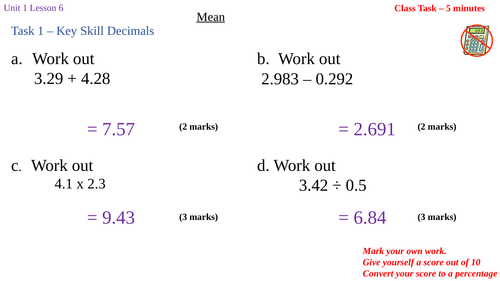
The Mean (Y7 Theta Edexcel 5 Year SOW U1 6) is a resource developed in line with the ‘Theta’ pathway.
This is part of a full unit of resourced lessons for the unit entitled ‘Analysing and Displaying Data’.
This resource contains:
Examples for the teacher to go through
Progressively written questions that develop challenge and promote problem solving throughout
AFL is fully embedded throughout the resource
This would be ideal for a teacher who is looking to cut down on workload, a non-specialist, or a leader of a department who wishes to improve practice of others within their team.
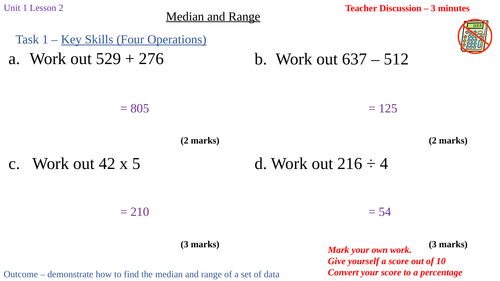
Median and Range (Y7 Theta Edexcel 5 Year SOW U1 L2) is a resource developed in line with the ‘Theta’ pathway.
This is part of a full unit of resourced lessons for the unit entitled ‘Analysing and Displaying Data’.
This resource contains:
Examples for the teacher to go through
Progressively written questions that develop challenge and promote problem solving throughout
AFL is fully embedded throughout the resource
This would be ideal for a teacher who is looking to cut down on workload, a non-specialist, or a leader of a department who wishes to improve practice of others within their team.
Comparing using Averages (Y7 Theta Edexcel 5 Year SOW U1 L8) is a resource developed in line with the ‘Theta’ pathway.
This is part of a full unit of resourced lessons for the unit entitled ‘Analysing and Displaying Data’.
This resource contains:
Examples for the teacher to go through
Progressively written questions that develop challenge and promote problem solving throughout
AFL is fully embedded throughout the resource
This would be ideal for a teacher who is looking to cut down on workload, a non-specialist, or a leader of a department who wishes to improve practice of others within their team.
The Mode (Y7 Theta Edexcel 5 Year SOW U1 L1) is a resource developed in line with the ‘Theta’ pathway.
This is part of a full unit of resourced lessons for the unit entitled ‘Analysing and Displaying Data’.
This resource contains:
Examples for the teacher to go through
Progressively written questions that develop challenge and promote problem solving throughout
AFL is fully embedded throughout the resource
This would be ideal for a teacher who is looking to cut down on workload, a non-specialist, or a leader of a department who wishes to improve practice of others within their team.
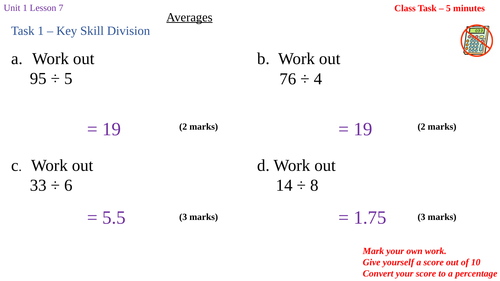
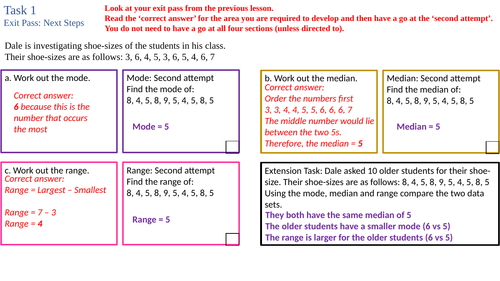
Calculating Averages (Y7 Theta Edexcel 5 Year SOW U1 L7) is a resource developed in line with the ‘Theta’ pathway.
This is part of a full unit of resourced lessons for the unit entitled ‘Analysing and Displaying Data’.
This resource contains:
Examples for the teacher to go through
Progressively written questions that develop challenge and promote problem solving throughout
AFL is fully embedded throughout the resource
This would be ideal for a teacher who is looking to cut down on workload, a non-specialist, or a leader of a department who wishes to improve practice of others within their team.
Bar Charts (Y7 Theta Edexcel 5 Year SOW U1 L4) is a resource developed in line with the ‘Theta’ pathway.
This is part of a full unit of resourced lessons for the unit entitled ‘Analysing and Displaying Data’.
This resource contains:
Examples for the teacher to go through
Progressively written questions that develop challenge and promote problem solving throughout
AFL is fully embedded throughout the resource
This would be ideal for a teacher who is looking to cut down on workload, a non-specialist, or a leader of a department who wishes to improve practice of others within their team.
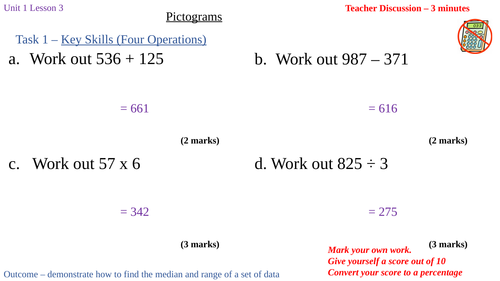
Displaying data (pictograms) (Y7 Theta Edexcel 5 Year SOW U1 L3) is a resource developed in line with the ‘Theta’ pathway.
This is part of a full unit of resourced lessons for the unit entitled ‘Analysing and Displaying Data’.
This resource contains:
Examples for the teacher to go through
Progressively written questions that develop challenge and promote problem solving throughout
AFL is fully embedded throughout the resource
This would be ideal for a teacher who is looking to cut down on workload, a non-specialist, or a leader of a department who wishes to improve practice of others within their team.
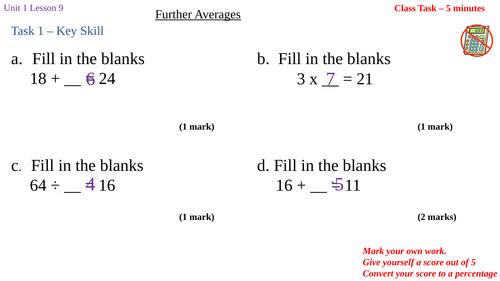
Further Averages (Y7 Theta Edexcel 5 Year SOW U1 L9) is a resource developed in line with the ‘Theta’ pathway. This lesson involves finding an unknown number within a data set if the mean is given
This is part of a full unit of resourced lessons for the unit entitled ‘Analysing and Displaying Data’.
This resource contains:
Examples for the teacher to go through
Progressively written questions that develop challenge and promote problem solving throughout
AFL is fully embedded throughout the resource
This would be ideal for a teacher who is looking to cut down on workload, a non-specialist, or a leader of a department who wishes to improve practice of others within their team.
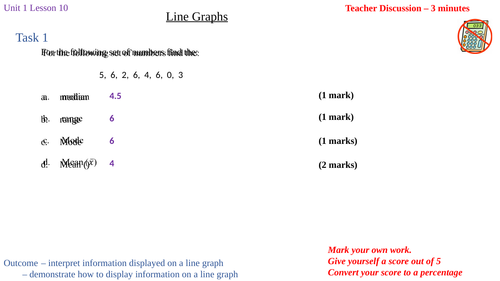
Line Graphs (Y7 Theta Edexcel 5 Year SOW U1 L10) is a resource developed in line with the ‘Theta’ pathway. This lessons involves interpreting and drawing line graphs
This is part of a full unit of resourced lessons for the unit entitled ‘Analysing and Displaying Data’.
This resource contains:
Examples for the teacher to go through
Progressively written questions that develop challenge and promote problem solving throughout
AFL is fully embedded throughout the resource
This would be ideal for a teacher who is looking to cut down on workload, a non-specialist, or a leader of a department who wishes to improve practice of others within their team.