jonathanremmington1Profitability Ratios (Gross Profit Margin, Operating Profit Margin, Return on Capital Employed) (0)
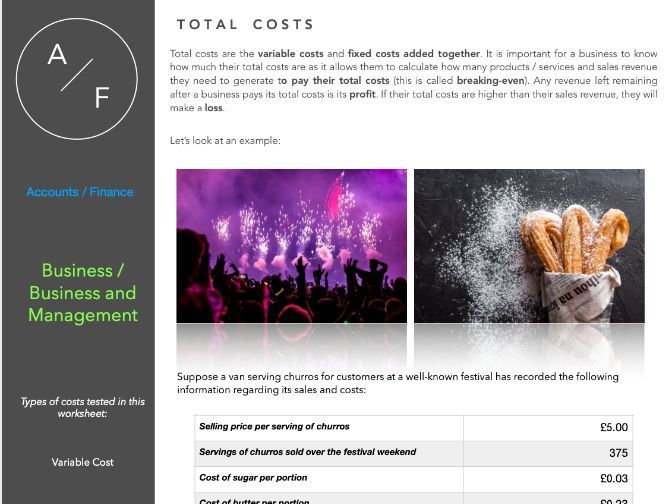
jonathanremmington1Types of Costs WORKSHEET (Fixed, Variable, Total, Average, Marginal, Direct, Indirect) (0)