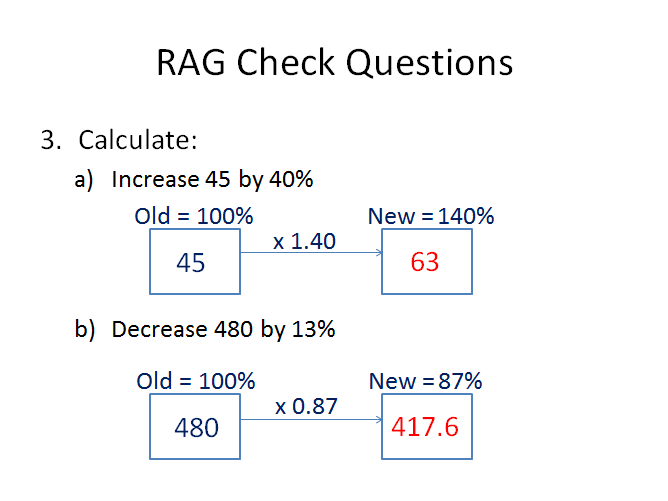
Hero image

23Uploads

57k+Views

111k+Downloads

Critical Angle & Total Internal Reflection
philhatchphilhatch

Critical Angle & Total Internal Reflection

(0)
Worksheet (2 pages) and Homework (1 page) (with answers) for Critical Angle and Total Internal Reflection. Including an explanation of light refracting away from the normal when leaving a denser medium, and how this relates to the critical angle. Calculations for working out the critical angle or refractive index when given one of those two values. Total internal reflection, its uses, and light ray diagrams for fibre-optic cables. A corresponding presentation is free to use and embedded at physics.mrhatchard.co.uk in Section 4 (Waves). Written for the Cambridge IGCSE Coordinated Sciences and Combined Sciences courses, but obviously a large content overlap with various GCSE courses also.
Light Ray Diagrams - Plane Mirrors
philhatchphilhatch

Light Ray Diagrams - Plane Mirrors

(0)
Worksheet (3 pages) and Homework (1 page) (with answers) for mirror diagrams, including the Law of Reflection (angles of incidence and reflection equal), and the concept of virtual images. Includes measuring angles of incidence/reflection. Opportunity to have able students practice trigonometry to calculate exact values of these angles using SOHCAHTOA (my answers are to nearest 0.5 degree). A corresponding presentation is free to use and embedded at physics.mrhatchard.co.uk in Section 4 (Waves). Written for the Cambridge IGCSE Coordinated Sciences and Combined Sciences courses, but obviously a large content overlap with various GCSE courses also.
Wave Speed, Frequency and Wavelength
philhatchphilhatch

Wave Speed, Frequency and Wavelength

(0)
Worksheet (2 pages) and Homework (1 page) (with answers) for Wave Speed, Frequency and Wavelength. Including using the formula, lots of calculation questions, including the odd question thrown in where they are given the period instead of the frequency, and where the units are not always metres and Hertz (but millimetres or kHz, for example). A corresponding presentation is free to use and embedded at physics.mrhatchard.co.uk in Section 4 (Waves). Written for the Cambridge IGCSE Coordinated Sciences and Combined Sciences courses, but obviously a large content overlap with various GCSE courses also.
Refraction of Light
philhatchphilhatch

Refraction of Light

(0)
Worksheet (2 pages) and Homework (1 page) (with answers) for Refraction of Light. Including refraction of light rays through parallel-sided (rectangular) glass blocks, and prisms. Explanation for refraction and dispersion of light, based on the frequency and wavelength of different colours. A corresponding presentation is free to use and embedded at physics.mrhatchard.co.uk in Section 4 (Waves). Written for the Cambridge IGCSE Coordinated Sciences and Combined Sciences courses, but obviously a large content overlap with various GCSE courses also.
Reflection, Refraction, Diffraction
philhatchphilhatch

Reflection, Refraction, Diffraction

(0)
Worksheet (2 pages) and Homework (1 page) (with answers) for an introduction to reflection, refraction and diffraction of waves. A corresponding presentation is free to use and embedded at physics.mrhatchard.co.uk in Section 4 (Waves). Includes definitions, wavefront diagrams, explanations for refraction. Written for the Cambridge IGCSE Coordinated Sciences and Combined Sciences courses, but obviously a large content overlap with various GCSE courses also.
Refractive Index
philhatchphilhatch

Refractive Index

(1)
Worksheet (2 pages) and Homework (1 page) (with answers) for Refractive Index. Including questions on the concept and definition, and calculations to find the refractive index, the angle of incidence, and the angle of refraction. A corresponding presentation is free to use and embedded at physics.mrhatchard.co.uk in Section 4 (Waves). Written for the Cambridge IGCSE Coordinated Sciences and Combined Sciences courses, but obviously a large content overlap with various GCSE courses also.
The Electromagnetic Spectrum
philhatchphilhatch

The Electromagnetic Spectrum

(0)
Worksheet (2 pages) and Homework (1 page plus second sheet for cutting and sticking) (with answers) for The Electromagnetic Spectrum. Including names of the different types of electromagnetic radiation, their uses and the risks and dangers. Some reference to speed, frequency and wavelength. A corresponding presentation is free to use and embedded at physics.mrhatchard.co.uk in Section 4 (Waves). Written for the Cambridge IGCSE Coordinated Sciences and Combined Sciences courses, but obviously a large content overlap with various GCSE courses also.
Area of 2D Shapes Recap Handouts with Presentation - versions with and without Circles
philhatchphilhatch

Area of 2D Shapes Recap Handouts with Presentation - versions with and without Circles

(0)
I try to keep my language consistent to help students draw connections, and link new rules back to the original concept they’re built on. So: Area always involves ‘width x height’. Included: Two versions of a presentation and a handout for students to fill in as you recap the rules on area of 2D shapes. One version without circles included, and one that includes circles, linking them to the same approach. Suited for classes who’ve seen the rules before but need more practice, and could do with seeing that actually all the rules for area are essentially the same rule but with adjustments included. The activity includes showing the rule and going through one example for each shape. I think this really starts to pay off once you start presenting trapeziums as ‘average width x height’ and circles as ‘three and a bit’ times bigger than a square drawn in one of its quadrants. Note: The presentations were made as Google Slides that I’ve made available to view online for free at maths.mrhatchard.co.uk. I’ve downloaded them as Powerpoint files and included them here so that you can keep them forever, edit them, print slides out, etc, which you can’t do with the online versions.
Rolling Dice Investigation
philhatchphilhatch

Rolling Dice Investigation

(0)
An investigation for combinations of possible outcomes, finding that there are more ways of getting some results, and introducing sample space diagrams. Students predict the results when rolling one and then two dice, and share results to build up a larger more reliable data set. There are then extension activities that they may choose from. Opportunities for students to: Make predictions Use the concept of ‘expectation’ Consider that a larger data set is more reliable and gives better predictions than a smaller one Consider whether individual dice might be biased, if this comes up in results Learn about sample space diagrams as an efficient way to list combinations of outcomes Extend the investigation to dig deeper into an aspect of their choice This investigation easily fills a whole lesson.
Bar Charts, Histograms, Frequency Polygons
philhatchphilhatch

Bar Charts, Histograms, Frequency Polygons

(0)
A lesson on Frequency Diagrams: Bar charts for discrete or qualitative data Histograms/bar charts for grouped continuous data with equal width class intervals Frequency Polygons Includes: Examples in a Smart Notebook file with accompanying worksheets for them to do along with the teacher. Worksheets with two examples of each type of frequency diagram for them to complete independently. Model answers included. The Notebook file builds slide by slide, so you can start to fill in the next detail to show them how it works (start to label axes, use rectangle tool for bars, for example), and then skip to the next slide to show what it should look like when that step in the process is complete.
Area of Straight-Edged Shapes on Grids - Presentation & Differentiated Worksheets
philhatchphilhatch

Area of Straight-Edged Shapes on Grids - Presentation & Differentiated Worksheets

(0)
Presentation and Differentiated Worksheets that move from the basics of counting squares, extend to tricky problem-solving and prompt students to discover the formula for area of rectangles for themselves. Includes one Powerpoint that goes through the basic concepts, two worksheets (3 pages each) that go through the core content at slightly different paces, and a Challenge worksheet (2 pages) that has students working out rectangles without a grid, much trickier areas to work out, and drawing shapes that have to match multiple given properties. Note: The presentation was made as Google Slides that I’ve made available to view online for free at maths.mrhatchard.co.uk. I’ve downloaded it as a Powerpoint file and included them here so that you can keep it forever, edit it, print slides out, etc, which you can’t do with the online version.
Scatter Graphs
philhatchphilhatch

Scatter Graphs

(19)
KS3 and KS4/GCSE activities on Scatter Diagrams/Scatter Graphs. Includes * a cheat sheet that I print on A3 in colour to put on the desks for them to refer to (can also double as a classroom display * a quick sorting activity where students pair up types of correlation to pictures of graphs and pairs of variables that would match each graph * a worksheet where students decide which scenario must go with each graph, and give reasons, and a prompt sheet with some suggested generic reasons for those who need it * some exam questions that I have edited a little to include parts asking students to identify types of correlation and describe the relationships in context
Percentages of Quantities - Calculator Methods - inc Reverse Percentage Change and Compound Interest
philhatchphilhatch

Percentages of Quantities - Calculator Methods - inc Reverse Percentage Change and Compound Interest

(0)
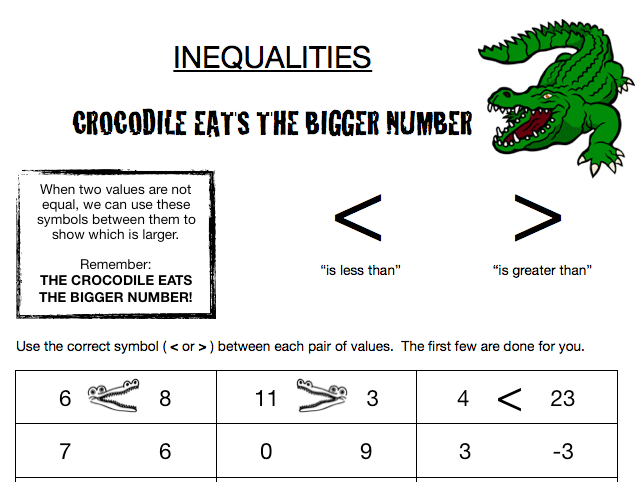
Resources I made for an interview lesson (I got the job) with a mixed ability group that had a wide range of abilities. Starts with a RAG activity so students can select their own starting point, which can range from Changing Percentages to Decimals, to Compound Interest. Each worksheet is an explanation of the skill, some basic questions and then exam questions. Enough resources to easily last two or three lessons. Presentation Pre-Lesson RAG Activity Percentages to Decimals Percentages of Quantities Percentage Change Reverse Percentage Change Compound Interest
Number Thermometer Display
philhatchphilhatch

Number Thermometer Display

(0)
A number thermometer for the wall going from 10 down to -10. I prefer to have a vertical number line rather than a horizontal one, as it feels much easier to explain numbers getting higher and lower if they’re going up and down. A blank unlabelled thermometer is included too, so if you laminate before putting it onto the wall you can write different numbers on.
Algebraic Substitution Introduction - Basic visual introduction
philhatchphilhatch

Algebraic Substitution Introduction - Basic visual introduction

(0)
Basic visual introduction to both writing expressions and substituting in values. This uses the concept of a variable as a physical token that has some monetary value. I've made it to use with some of my Year 11s who have some big gaps in their understanding so I'm going back to basics with them. I'm going onto solving equations from here so I'll add more when I build on this topic a bit later.
Inequalities - Using the signs correctly, listing integer results and inequalities on a number line
philhatchphilhatch

Inequalities - Using the signs correctly, listing integer results and inequalities on a number line

(2)
For KS3 or KS4 (particularly low ability). "Crocodile eats the bigger number" using the signs correctly between two values, then between 2 sums, then with a little bit of simple algebra (with values of a, b and c given). Listing the possible integer solutions of a simple inequality. Representing inequalities on a number line, and writing inequalities down from a number line. Quite a few answers to odd questions are done for them to help the students check their own approach as they go.
Sports Leagues Data Handling Investigation
philhatchphilhatch

Sports Leagues Data Handling Investigation

(0)
A short investigation that has students finding the number of possible combinations of pairs items from a given set, through listing numbers of games played in different sizes of sports league. Able students will find the algebraic rule - n(n-1) games when playing home and away - and find the link to triangle numbers when teams only play each other once. Plenty of possible extensions that I’ll leave up to you!
Skills by Level & Grade Boundary Calculators
philhatchphilhatch

Skills by Level & Grade Boundary Calculators

(0)
This is a spreadsheet that tries to show where Maths skills fit in comparison to the newer GCSE (9-1) Grades, and how that compares to the old A*-G grades and National Curriculum Levels. In addition there are various Grade Boundary calculators in the last tab to help when you are setting assessments (especially those you’ve written yourself). It also shows ‘trajectory’ grades to indicate where KS3 students might be judged to be heading (something my old school used for assessing KS3 students - so the mythical “average progress” student might be assessed at grade 6 in Year 7, then grade 6 again in Year 8 and so on). I’ve put this together from lots of documents around showing what skills came under old National Curriculum levels and GCSE letter grades. I’ve used those and my own judgment to give an overall idea where these skills fit into the new(ish) grading system. There are a few skills missing from this, especially towards the top end of the grades, and obviously many of the skills can be framed in a question to make them easier or harder than the grade suggested, so there’s some professional judgement needed in using this. The last tab of the spreadsheet is full of various grade boundary calculators. Between them, these allow you to: Convert GCSE grade thresholds into KS3 “trajectory” grade thresholds Convert old NC Level and GCSE (A*-G) grade thresholds into new GCSE (9-1) thresholds Count up the number of marks at each grade or level in a test and convert them into grade boundaries Convert actual grade boundaries into standardised scores (eg if you want to standardise all test scores so students always know 10 marks is grade 1, 20 marks is grade 2, 30 marks is grade 3, etc and can compare more easily with previous performance) I’ve got three different versions of that last one so you can do KS3, Foundation GCSE and Higher GCSE differently if you want. Mostly when setting my own tests, I would count up the number of marks I judged to be at different National Curriculum Levels, use the third calculator to calculate NC Level boundaries, and then paste those into the second calculator to get grade boundaries for each year group. Having used (and tweaked) this consistently for at least two years, I’ve found it to be pretty consistent and accurate with the grades students have ended up with. I sometimes find I feel the grade 2 and 3 boundaries are a little on the low side, however, so you may adjust them accordingly if you don’t agree with the calculators! It’s also available as a Google Sheets document and you should be able to download it as an Excel file (or copy it to your own drive). This way if I update it, I don’t have to re-upload it somewhere, it will always automatically be the latest version - https://docs.google.com/spreadsheets/d/1qlo_retd0N66fkAbuWz1ar5MEivE6QimpSBYh6z0rZM/edit?usp=sharing
Properties of Numbers Displays
philhatchphilhatch

Properties of Numbers Displays

(3)
Doc and PDF formats. Includes: * Factors & Multiples (which I used by printing together onto A3 and laminating) * Prime Numbers and Prime Factors (which I used by printing together onto A3 and laminating) * Square Numbers (which I printed, sliced up into its individual squares, laminated, then sliced up again and stuck on the wall in sequence) * Cube Numbers (did as above with the square numbers)