I am a firm believer that 75% of behaviour issues in a classroom can be controlled through the resources given to students. I have worked with a lot of low ability classes where constructive work is essential. The scheme of work can be tough for pupils to access and I have had to really think about prior knowledge and breaking work down into manageable pieces. My aim is to make worksheets that cater for all, enable students to keep busy and progress from section to section.
I am a firm believer that 75% of behaviour issues in a classroom can be controlled through the resources given to students. I have worked with a lot of low ability classes where constructive work is essential. The scheme of work can be tough for pupils to access and I have had to really think about prior knowledge and breaking work down into manageable pieces. My aim is to make worksheets that cater for all, enable students to keep busy and progress from section to section.
A student friendly resource for drawing and interpreting line graphs which progresses. There are 6 available typical questions to plot and interpret. There is enough here for a lesson. This is suitable for KS3 and KS4.
Contains a starter, an activ inspire flipchart, explanations and worksheets with answers. This focuses on calculating the mean, mode and range from bar charts.
Differentiated worksheet
First page - Plotting equations (positive), i.e y = 3x + 2
Second page - Plotting equations (negatives), i.e y = -2x + 1
Third page - Plotting equations (fractions), i.e. y = -1/2x + 3
I have also attached some past GCSE questions
10 questions to keep your students busy.
Students are to sort data into frequency tables, then draw a bar chart from the table. They are then to use the bar chart to find the mode and the range. These worksheets progress from ungrouped data to grouped data. The tables use tally charts to keep track of sorting. Excellent resource to use with any class.
Here are two very structured worksheets on compound area.
The first worksheet is for only rectangles. The first section focuses on finding the area of plain rectangles. The second section puts two rectangles together and students are to fill in the missing lengths. The third section, students are to split up the rectangles themselves.
The second worksheet is for rectangles and triangles with the same structure as the first worksheet. Suitable for KS3 and KS4
This resource will help any ability student. Attached is the answers.
Please leave feedback :)
Excellent worksheet for measuring bearings. Included is a PowerPoint and activInspire flipchart. Suitable for KS4. Contains a starter, explanations and all answers are included.
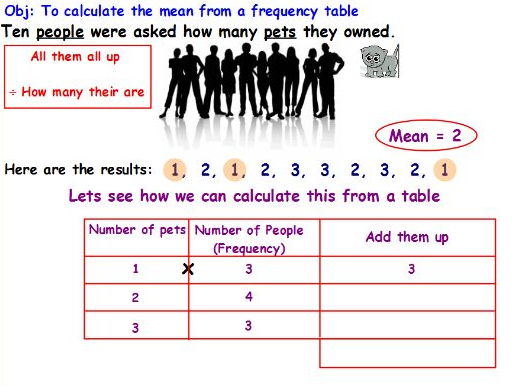
I was fed up of just telling my students to multiply across, add this column, add that column, divide this column by the total of that one and there is the mean... This is what I ended up making:
Starter - Students are asked to calculate the mean from a set of numbers (10 people who were asked how many pets they owned). Easy numbers to divide, straight forward. At this point, I like to demonstrate exactly what mean is
How many pets do these people have?
"Instead of saying this person has 2 pets, this person has 3 pets, this person has 1 pet etc... we just want one number, an average number called the mean which we just worked out"
Main - The starter links straight into the main where the data is sorted into a frequency table and it's demonstrated how we get the same answer working from this table. I really break up the process and go through the whole "add them up" highlighting each of the same numbers and showing that we multiply across, students clearly see where things come from (see my cover image).
On top of this, I have included 5 questions where students sort data into the frequency tables and find the mean (very structured and you can explain why they are multiplying across, adding and dividing). I have a section for just finding the mean from numbers in case some students need to work on finding mean from numbers. I also have a section for calculating mean from a plain frequency tables when your students really get the idea (so there is differentiation). I did this lesson with a weak year 8 class and they got a lot out of it. I highly recommend this, you won't be disappointed. One of my best resources.
Answers are all included. Attached is an activInspire flipchart and worksheets.
A constructive worksheet that clearly demonstrates positive (Q1), negative (Q2) and no correlation (Q3). The questions also include interpreting after plotting. Suitable for KS3 and KS4
Starter - plotting co-ordinates
flipchart - consists of worksheet solutions
Here is a few lessons with many resources for constructing frequency tables. The slides show how we can construct a frequency table from paragraphs. The starter gets the students working straight away and progresses from ungrouped to grouped data. I have attached some more worksheets that you students can do with you whilst your going through the problems on the board. I have done all the hard work for you. Many, many questions and click button answers at the ready. Suitable for both KS3 and KS4
Starter
Main worksheet A
Main worksheet B
Go through resources
ActivInspire flipchart
Lesson plan - Teep new format
This lesson is suitable for lower and upper ability students. The work is differentiated and I have taught this to a mixed ability class. I have put bar model into the questions (its a fantastic method of teaching ratio). Suitable for both KS3 and KS4
The lesson focus's on the following skills and the worksheet is structured this way:
First section - Sharing out amounts - boxes are used for visual representation (bar model)
Section section - Given the ratio and the quantity, students are to find the other quantity (bar model)
Third section - Students are to find the totals given the ratio and a quantity (bar model)
Fourth section - This is a mixture of questions and students are to construct bar models
There is assessment opportunities to measure the progress at the start and at the end of the lesson. The starter Is basic division which I find works very well to settle students down quickly at the start of a lesson.
A lesson plan is attached explaining how I have gone about it.
Everything you need for a lesson observation is here. This is a very constructive lesson that you will not be disappointed with. This is an active inspire flipchart with worksheets.
Starter - Basic Scale Factor for enlargement of squares, rectangles and triangles with answers provided.
Discussion 1 - The starter links for discussing what similarity is from the shapes they enlarged. Students are shown two shapes and are asked if they are similar and why. This being that the lengths have been multiplied by the same number (SF) meaning they are similar. Identifying similarity, congruency and none is discussed here.
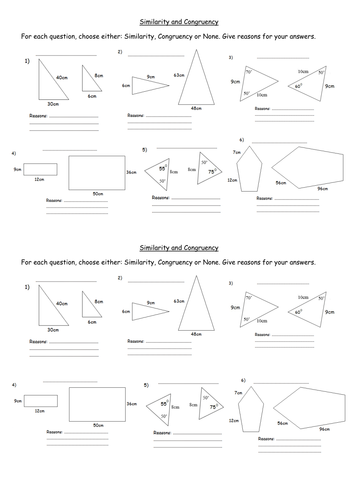
Activity 1 - Pair activity identifying similarity, congruency and none + answers
Discussion 2 - Identifying Scale factor from two shapes given they are similar. Working out SF and finding missing lengths. Challenging similar triangle shapes included for discussion.
Activity 2 - Differentiated worksheet task covering all of the above.
- Calculating SF
- Finding missing lengths using SF
- Finding missing lengths for complex triangle similar shapes
Answers included
Plenary - Provides a link to the real world or to test them against the GCSE question at the start to demonstrate good progress
Contains a starter, active inspire flipchart, 3 x worksheets which are also differentiated by outcomes. Assessments at different points in the lesson and a plenary. I used this for both KS3 and KS4, very suitable for a lesson observation.
Section A - Worksheet 1 is all about reading scales found on typical graphs where the scale isn't increasing by 1. Here we have 14 questions with structure to help your students get this part right.
Section B - Here are 6 questions for interpreting from a distance time graph. Before students start the question, they have to work out what each division is worth for both Distance and Time for the question (what it's increasing by each time). This is structure to help them access the common distance time graph questions found on exams. For each question are a set of good quality questions.
Powerpoint with starter and all answers to both worksheets. Very suitable for higher ability classes.
Student friendly worksheets
Section A - 14 questions to get your students reading scales before attempting distance time graphs
Section B - consists of 6 questions for interpreting distance time graphs.
Suitable for both KS3 and KS4
Everything you need for a lesson observation lesson is here. You won't be disappointed.
Lesson plan
Starter and extension
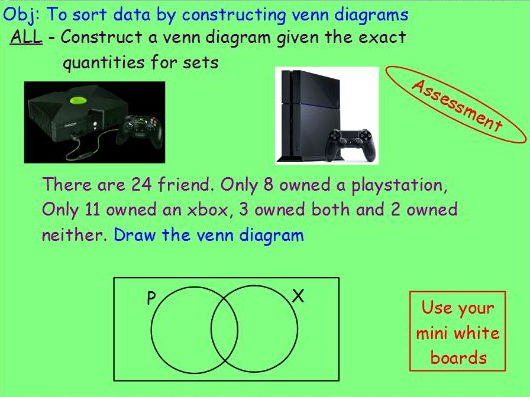
Assessment
card sort activity (differentiated)
Further assessment
Worksheet activity
Plenary
All this is attached including the ppt. I taught this to a mixed ability class and every student achieved for my set learning outcomes. This resource is aimed at all KS3 and KS4 students.
Here is a lesson I put together for a lesson observation and received lots of credit. There are two options of starters (I personally would pick the T-shirt starter). The lesson is differentiated to ensure all learners progress. The lesson is suitable for both KS3 and KS4.
Starter
Starter 2 optional
Main worksheet differentiated
Extra challenge questions
Flipchart with suitable examples, assess and show progression
Detailed lesson plan
A very student friendly resource solving simultaneous equations graphically (8 questions). I made this because I was struggling to find any resource that just allow the students to practice the skill without having to get them to draw a graph or having the issue with the equations not crossing. I taught this by setting x = 0 and finding the y value. The equations are nice to work with when set to zero. This resource will save you a lot of time and effort.
A constructive worksheet for calculating the surface area of a cylinder. This can be used as a handout that students do whilst your explaining the steps.
What do you think? Please leave feedback.
Starter - Prior knowledge
The first part of the lesson focus’s on the rule for a parallelogram and calculating its area.
The second part of the lesson includes algebra to find missing lengths.
The plenary is a typical GCSE question.
Please leave me your thoughts and comments as I can make improvements. I have used activ-inspire flipchart for the lesson but managed to screen shot all the slides onto powerpoint.
Enjoy.