
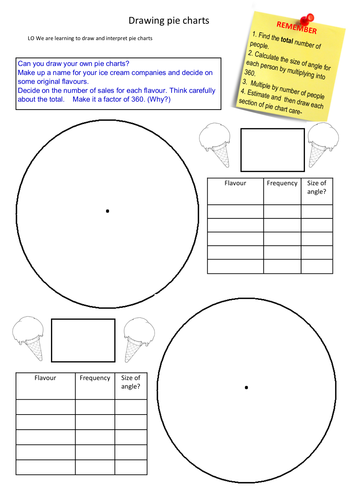

There are two worksheets here which ask the pupils to firstly draw and then interpret pie charts. In both cases, data is given in the form of a table relating to sales of ice creams. The first worksheet gives pupils sets of data and asks them to construct their own pie charts. The second worksheet asks pupils to invent their own ice cream flavours and to construct pie charts based on this data.
The resource is supplied in both pdf and Publisher format for easy editing and customization.
Thank you for your interest in my resources. I hope you find them useful.
The resource is supplied in both pdf and Publisher format for easy editing and customization.
Thank you for your interest in my resources. I hope you find them useful.
Something went wrong, please try again later.
This resource hasn't been reviewed yet
To ensure quality for our reviews, only customers who have purchased this resource can review it
Report this resourceto let us know if it violates our terms and conditions.
Our customer service team will review your report and will be in touch.
£2.00