


**A ready-to-teach Year 6 reasoning lesson focused on interpreting segmented bar graphs, comparing data and calculating fractions and percentages in KS2 maths.
This lesson develops pupils’ ability to analyse data displays, identify relationships between groups and solve multi-step questions using information presented in segmented bar graphs.**
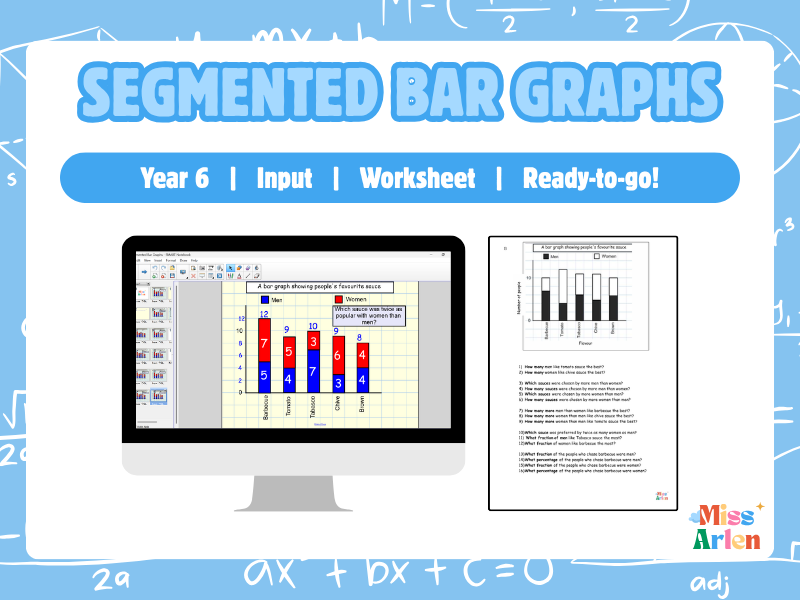
This Year 6 maths lesson focuses on interpreting segmented bar graphs and using data to answer reasoning questions.
Pupils develop their understanding of how information can be compared across categories and groups. They practise extracting information from segmented bar graphs, calculating differences, identifying relationships and finding fractions and percentages of data sets.
The lesson includes a range of questions that require pupils to compare values, reason about proportions and apply their wider maths knowledge in a statistics context.
Teachers can use the included Smart Notebook input slides to model strategies clearly and guide pupils through examples before independent practice.
Pupils then complete a differentiated independent activity designed to support all learners while still providing appropriate challenge. The tasks build confidence with statistics, data interpretation and SATS-style reasoning questions.
This resource is ideal for Year 6 statistics lessons, KS2 data interpretation practice, SATS revision, or targeted intervention sessions.
What’s Included
✔ Smart Notebook input slides for teacher modelling
✔ Differentiated independent worksheets (3 levels)
✔ Plenary task
✔ Full answers included
Why Teachers Use This
✔ Ready-to-teach lesson with no planning required
✔ Develops confidence interpreting segmented bar graphs
✔ Includes fractions, percentages and comparison questions
✔ Supports SATS-style statistics reasoning
✔ Differentiation built in for mixed-ability Year 6 classes
Lesson Breakdown
✔ Input: Teacher modelling of segmented bar graph interpretation
✔ Guided Practice: Comparing groups and identifying patterns in data
✔ Independent Task: Differentiated worksheets (3 levels)
✔ Plenary: Reasoning discussion and consolidation
✔ Answers: Included for marking or self-assessment
Something went wrong, please try again later.
This resource hasn't been reviewed yet
To ensure quality for our reviews, only customers who have purchased this resource can review it
Report this resourceto let us know if it violates our terms and conditions.
Our customer service team will review your report and will be in touch.
£1.45