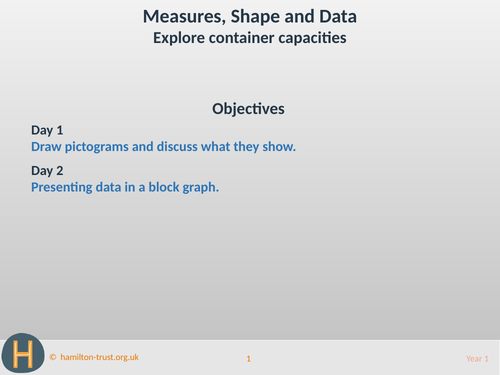


This presentation provides two days of teaching that cover the objectives:
- Draw pictograms and discuss what they show.
- Presenting data in a block graph
It includes starter activities, whole class teaching, group activities, practice sheets and mastery questions. It can be used on a variety of interactive whiteboards.
Day 1 Teaching
Show children 4 bowls, all of different sizes. These bowls were left in the 3 bears’ house. Remind children that to find out more about how much they hold, we can measure by filling each with cups of water. Demonstrate how to draw a pictogram to record the capacities measured in numbers of cups.
Day 2 Teaching
The Three Bears and Goldilocks have invited Jack and Jill for tea! The only problem is they have lots of different-sized glasses for their homemade lemonade. Measure the capacity of two of the glasses, modelling recording results in a table, then transferring data onto a block graph.
This teaching is part of Hamilton’s Year 1 Measures, Shape and Data block. Each Hamilton maths block contains a complete set of planning and resources to teach a term’s worth of objectives for one of the National Curriculum for England’s maths areas.
Something went wrong, please try again later.
This resource hasn't been reviewed yet
To ensure quality for our reviews, only customers who have purchased this resource can review it
Report this resourceto let us know if it violates our terms and conditions.
Our customer service team will review your report and will be in touch.
