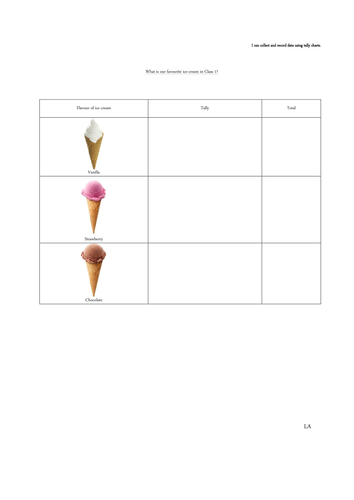


The children in my class collected data in a tally chart to show which ice cream flavour was the most popular in our class. They then represented the data in a pictogram in ICT.
Something went wrong, please try again later.
This resource hasn't been reviewed yet
To ensure quality for our reviews, only customers who have purchased this resource can review it
Report this resourceto let us know if it violates our terms and conditions.
Our customer service team will review your report and will be in touch.
£3.00