
A lesson on Frequency Diagrams:
- Bar charts for discrete or qualitative data
- Histograms/bar charts for grouped continuous data with equal width class intervals
- Frequency Polygons
Includes:
- Examples in a Smart Notebook file with accompanying worksheets for them to do along with the teacher.
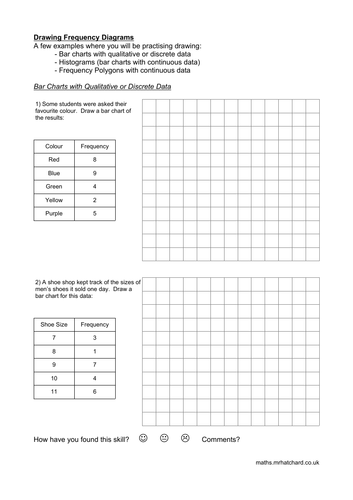
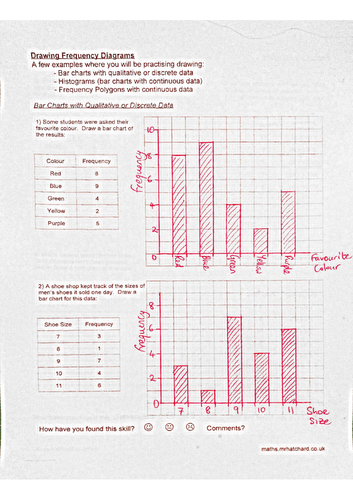
- Worksheets with two examples of each type of frequency diagram for them to complete independently. Model answers included.
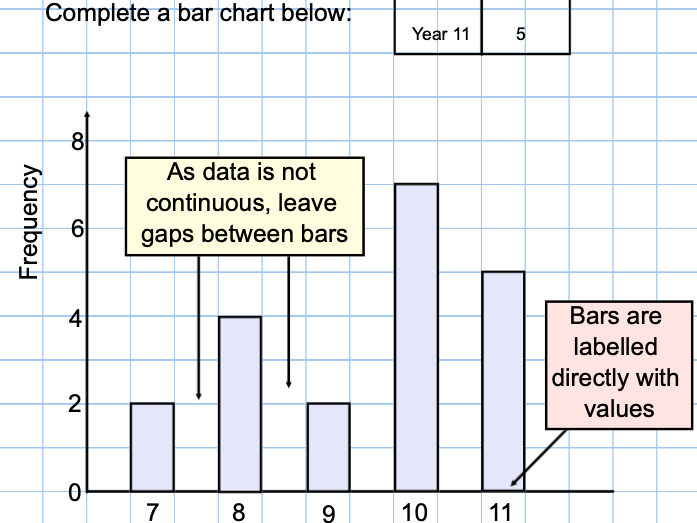
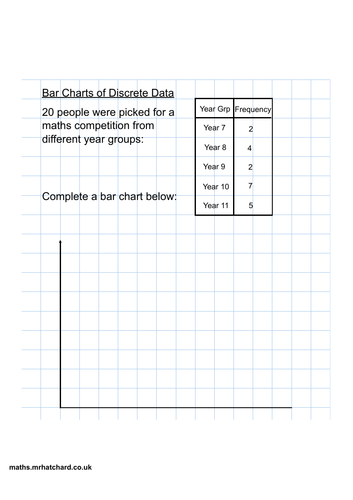
The Notebook file builds slide by slide, so you can start to fill in the next detail to show them how it works (start to label axes, use rectangle tool for bars, for example), and then skip to the next slide to show what it should look like when that step in the process is complete.
Something went wrong, please try again later.
This resource hasn't been reviewed yet
To ensure quality for our reviews, only customers who have purchased this resource can review it
Report this resourceto let us know if it violates our terms and conditions.
Our customer service team will review your report and will be in touch.
£3.00