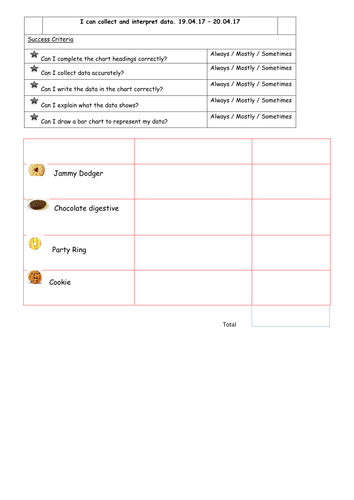

This is a worksheet where the chn have to discuss what the tally chart is about. LO and SC are included on the worksheet. Then the chn have to write the headings above the columns on the chart. Next the chn have to collect the data themselves, asking their peers which biscuit is their favourite and record it in tallies on the chart. Chn have to complete the chart and then discuss what they have found.
Finally I asked the chn to draw a bar graph and then analyse the data in their books.
Finally I asked the chn to draw a bar graph and then analyse the data in their books.
Something went wrong, please try again later.
This resource hasn't been reviewed yet
To ensure quality for our reviews, only customers who have purchased this resource can review it
Report this resourceto let us know if it violates our terms and conditions.
Our customer service team will review your report and will be in touch.
£2.00