
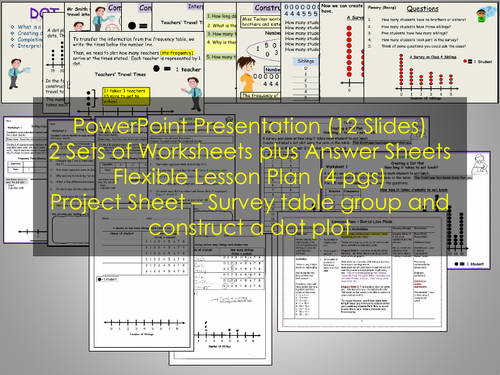
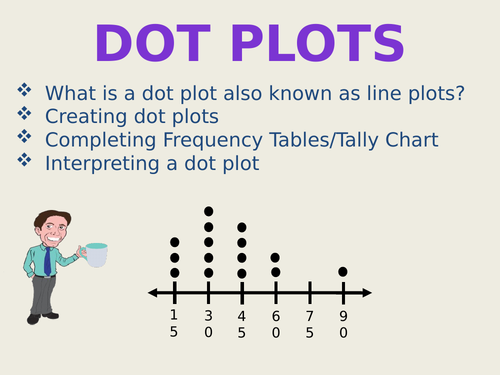

This resource relates to statistics on the topic of dot plots. It introduces dot plots on PowerPoint (12 Slides). The presentation demonstrates how the data was collected, rearranging data in numerical order, and presenting the data on a frequency table. Using the information on the frequency table, students are shown how to create a dot plot/line plot via Slide Show animation. Two detailed examples are shown.
Content:
• PowerPoint Presentation (12 Slides)
• 1 Flexible Lesson Plan (1- 2 hrs)
• 2 Sets of worksheets (4pgs)
• 1 ready-made project sheet for students to survey their table group
• 1 project sheet example
Flexible Lesson Plan (4 pgs)
The plan includes a lesson starter on adding two-digit numbers together. The method is adding the tens numbers first and then counting on the ones for quick mental addition. (If you wish, you can choose your own mental starters). Also includes lesson objectives, main activities on dot plots and recap session. Presentation slides are referred to and there are suggested questions you might want to ask your students.
PowerPoint Presentation
The presentation explains a dot plot and then looks at two examples from capturing the raw data, presenting them in frequency tables, and then creating dot plots.
Case study 1: Students are shown how Mr Smith creates a dot plot from data how long it takes his staff to travel to school.
Case study 2: Students are shown how Miss Tucker creates a dot plot to see how many siblings each of her students have.
Independent Practice
Worksheet 1 (2pgs): Selling Cupcakes
Page 1 - Students read a very short paragraph in order to insert the information in a frequency table and then they create a dot plot.
Page 2 – Students interpret the dot plot by answering 8 questions.
Worksheet 2 (2pgs): How Many Minutes to Eat Lunch
Page 1 - Students read the data on the frequency table to complete a dot plot.
Page 2 - Students answer 9 questions about the dot plot.
Answer sheets included.
Early finishers/Extra work
Project sheet: In their groups, student carry out a small survey on how many siblings each person in their group has. The students complete the ready-made sheet and then create a dot plot. An example sheet is included.
You may also be interested in Pictographs, Block Graphs, Bar Charts, Tallying
https://www.tes.com/teaching-resource/pictograms-block-graphs-bar-charts-tally-charts-tables-presentations-worksheets-11232570
Thank you for visiting my shop:)
Something went wrong, please try again later.
This resource hasn't been reviewed yet
To ensure quality for our reviews, only customers who have purchased this resource can review it
Report this resourceto let us know if it violates our terms and conditions.
Our customer service team will review your report and will be in touch.
£3.00