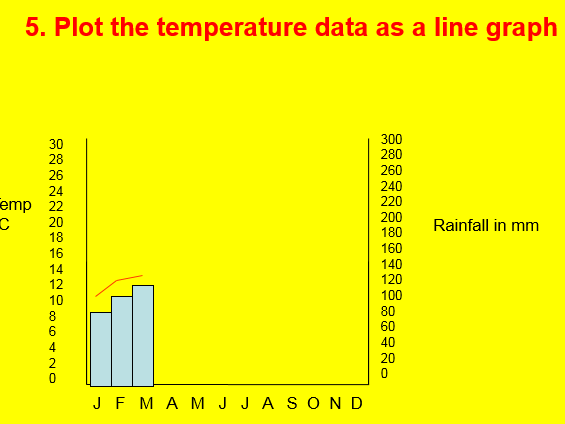


Step by step instructions for drawing two climate graphs, one for Manaus in Brazil and one for London as a comparison. Includes outline axes for lower ability.
Something went wrong, please try again later.
This resource hasn't been reviewed yet
To ensure quality for our reviews, only customers who have purchased this resource can review it
Report this resourceto let us know if it violates our terms and conditions.
Our customer service team will review your report and will be in touch.
£1.00