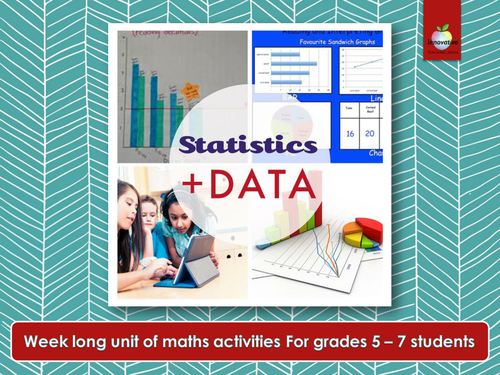
Make math relevant and engaging for kids with this elementary stats and data project. This no prep, hands-on project will keep your class busy for a full week.
***************************************************************************
This insightful project makes a great, lively introduction to graphs, charts, tables, and data collection for kids. For complex tasks, we’ve included video tutorials to help your students easily grasp new concepts. When you purchase this PBL pack, you will cover:
How to ask and survey an “essential question”
Data collection methods
Drawing mathematical conclusions from data
Presenting data in graphs and tables
Presenting data and conclusions to peers
LIKE WHAT YOU SEE?
For more creative ideas and new product updates, be sure to sign up for our EMAIL NEWSLETTER, and visit us on FACEBOOK to take part in our exclusive giveaways.
POPULAR PRODUCTS FROM INNOVATIVE TEACHING IDEAS
FULL YEAR VISUAL WRITING PROMPTS BUNDLE
110 Reading Activities Bundle
TEACHING DIGITAL TECHNOLOGIES & STEM
POETRY POWER PACK
GOOGLE SEARCH LIKE A BOSS
SEE OUR ENTIRE COLLECTION HERE
Something went wrong, please try again later.
Unfortunatly this was one of the first ones that came up after I typed in Primary and ages 7-11. This is not the case. Very unhappy :-(
Report this resourceto let us know if it violates our terms and conditions.
Our customer service team will review your report and will be in touch.
£3.00
