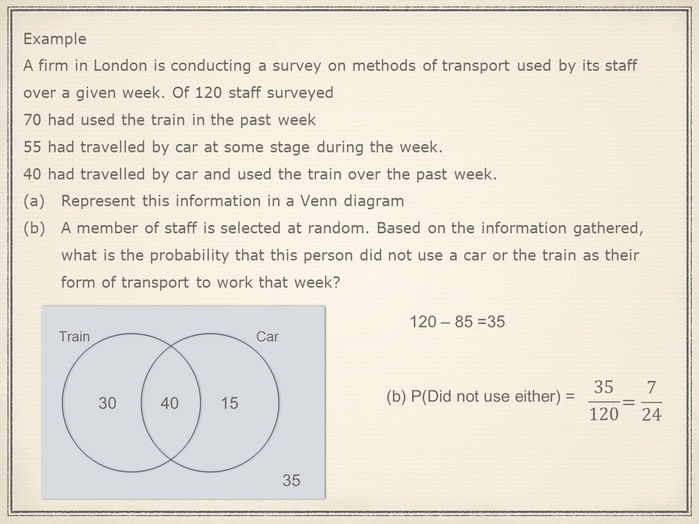
This lesson is demonstrates through worked examples how Venn diagrams can be used to obtain the probability of a given event.
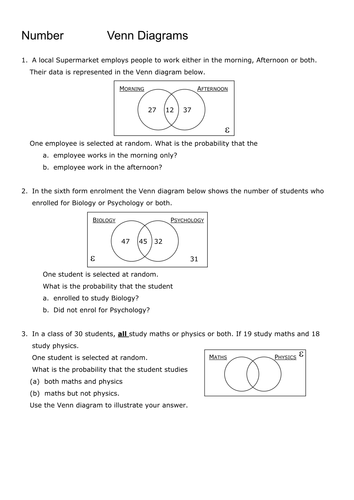
The lesson also has a worksheet attached.
The lesson also has a worksheet attached.
Get this resource as part of a bundle and save up to 30%
A bundle is a package of resources grouped together to teach a particular topic, or a series of lessons, in one place.
Something went wrong, please try again later.
Report this resourceto let us know if it violates our terms and conditions.
Our customer service team will review your report and will be in touch.
£3.00